Crypto Bull Market Gets Narrow
Bitcoin dominance recently rose to the highest in more than 2 years, and that resonates with the current stock market propped up by just a few companies. Should we be worried?
Bitcoin Outperforms
Bitcoin dominance (defined as the Bitcoin market cap divided by the total crypto market cap) roses to the highest level since April 2021, breaking out of its recent trading range.
Bitcoin dominance

The primary reason for higher Bitcoin dominance is an altcoin drop due to regulatory issues. Several altcoins were recently named unregistered securities by the US regulators, causing the delisting of these coins by some popular platforms (like Robinhood). Binance coin was decimated by the lawsuit against the exchange. Unlike most altcoins and Ethereum, Bitcoin is very similar to a commodity with a symbolic value (like gold), since it’s decentralized, pays no interest, and cannot be viewed as a business venture in any form. Thus, it is widely considered to be least likely designated as a security by the US regulators.
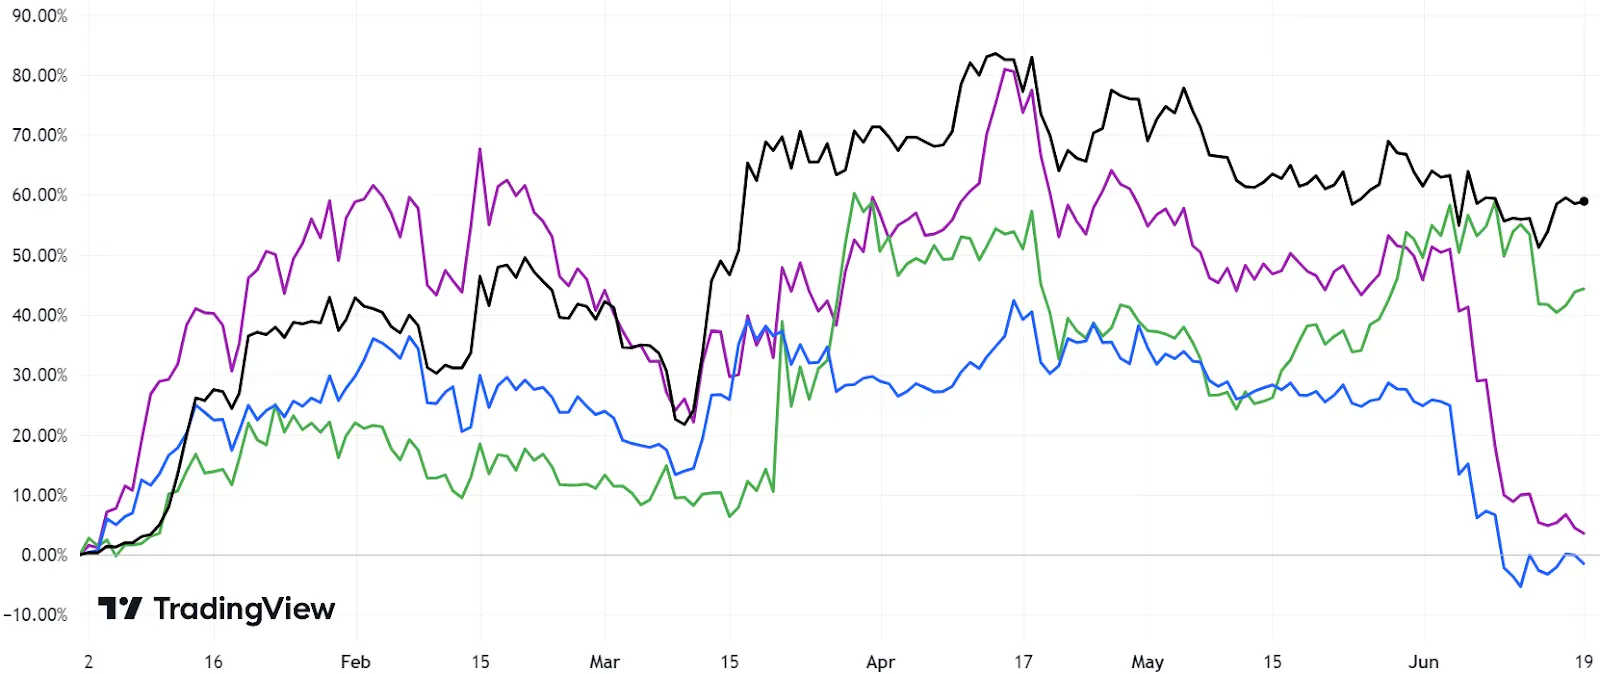
Among the three largest altcoins by market cap, Binance coin, and Cardano have recently lost their year-to-date gains and XRP has underperformed Bitcoin despite continued optimism regarding its legal battle with the US regulators.
Year-to-date performance of Bitcoin (black), Binance coin (blue), XRP (green), and Cardano (purple)*

Bitcoin dominance may even underestimate the actual outperformance of Bitcoin vs altcoins due to the continued popularity of stablecoins. Stablecoins’ market cap has been far more resilient than altcoins’ market cap, making a relatively low contribution to Bitcoin dominance growth compared with altcoins.
The two largest stablecoins (USDT and USDC) surrendered about 2% of their combined dominance. USDC became less popular after temporarily losing its peg in March, but USDT increases its market cap.
USDT (black) and USDC (blue) dominance

Concentrated Growth
More generally, high Bitcoin dominance reflects that crypto gains have been heavily concentrated in a few coins this year. Year-to-date growth of crypto market cap is due to Bitcoin, Ethereum, and USDT, while combined other coins (as a sum) are left behind.
Nearly all crypto gains this year are explained by just the three largest coins. The total crypto market cap rose from $756b at the year-end to $1039b on June 18. 70% of this growth is explained by Bitcoin's advances, as its market cap increased from $318b at the year-end to $516b on June 18. ETH market cap increased from $146b at the year-end to $209b on June 18. USDT market cap increased from $66b at the year-end to $83b on June 18. Overall, these three coins provided 98% of crypto market cap gains year-to-date.
Year-to-date crypto total market cap growth by coins

S&P 500 Rally is Even Narrower
Intriguingly, the concentrated bull market in crypto strongly resembles stocks. Stock market growth this year is arguably even narrower than in crypto as the S&P 500 rally is largely explained by just 7 stocks (out of more than 500), which is highly unusual. Apple, Microsoft, Amazon, NVIDIA, Google, Tesla, and Meta are responsible for about 90% of year-to-date gains of the S&P 500. The few largest positions have driven the S&P 500 index while combined other stocks (as a sum) stagnate.
10 largest positions of the S&P 500
Source: ETF.com, Yahoo Finance
I’m not sure about crypto (due to a very short trading history), but in stocks, it looks like a negative market sign. Narrow breadth is not a perfect market timing indicator, but it does indicate the later stages of a bull market. Even in the current bull market (since the end of the third quarter of 2022) small caps had outperformed the S&P 500 till early March (when the banking crisis unfolded).
SPDR S&P 500 ETF Trust (SPY, blue) and iShares Russell 2000 ETF (IWM, orange)

Conclusion
The current bull market in crypto becomes very concentrated, and in stocks, it’s arguably even narrower. The S&P 500 rally this year is largely explained by just 7 large-cap tech stocks with high index weights.
A bull market tends to have a wide breadth in the early stages and to get more narrow later. I’m not sure about crypto (due to a very short trading history), but the current stock market does look unhealthy. Given the usual correlations between different assets, a stock market view is related to crypto too. That is not a perfect market timing indicator, but I would advise caution both in stocks and crypto for the next few months.
*This communication is intended as strictly informational, and nothing herein constitutes an offer or a recommendation to buy, sell, or retain any specific product, security or investment, or to utilise or refrain from utilising any particular service. The use of the products and services referred to herein may be subject to certain limitations in specific jurisdictions. This communication does not constitute and shall under no circumstances be deemed to constitute investment advice. This communication is not intended to constitute a public offering of securities within the meaning of any applicable legislation.


