What Is a Spinning Top Candlestick?
What Is a Spinning Top Candlestick?
The spinning top candlestick is a type of Japanese candlestick chart. Its presence on a chart is often a reflection of the market's uncertainty, where neither the buyers nor the sellers have a clear advantage. The pattern indicates a balance during the trading period. This balance, especially in a market as dynamic as cryptocurrency, can be a precursor to significant price movements.
Key Takeaways
- The spinning top candlestick is distinguished by its slender body, which is flanked by elongated upper and lower shadows.
- The pattern symbolizes a standoff between buyers and sellers, where neither party has managed to secure a decisive victory.
- The spinning top's emergence in the financial charts is often seen as a sign of potential trend reversals, making it a crucial tool in a trader's arsenal.
What Does a Spinning Top Candlestick Tell You?
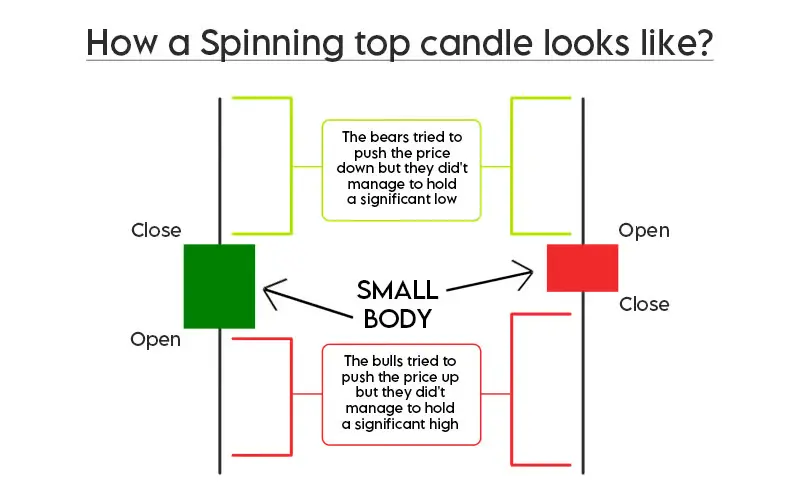
A spinning top pattern is represented on a chart by a single candle with a short body, but long upper and lower wicks. It indicates a prevailing uncertainty regarding the asset’s future trajectory. At the same time, the long shadows reveal that this equilibrium was challenged throughout the trading period by buyers and sellers. Both the bulls and the bears tried to dominate the market, but ultimately ended in a draw.
What Is a Candlestick?
For novice traders, we will briefly explain what a candlestick is.
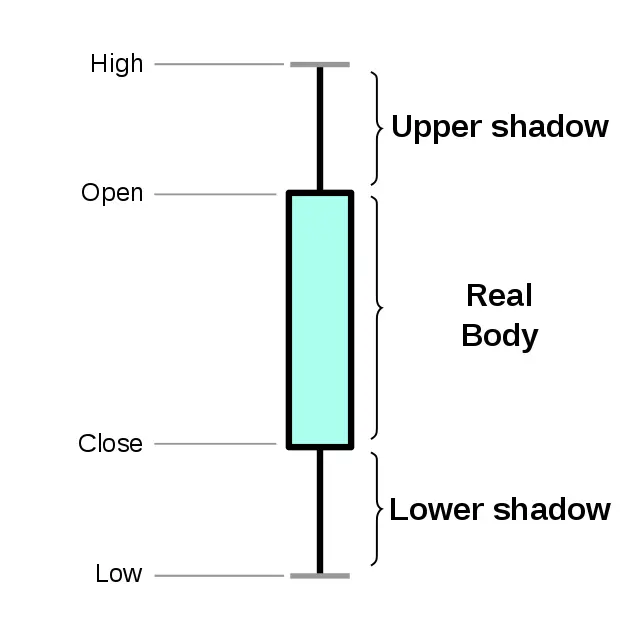
A candlestick is a visual representation of price movements within a specific timeframe, offering a comprehensive snapshot of the market's dynamics. Together, candlesticks form a chart which can be used for traders to analyze the price movement of various patterns, including cryptocurrencies.
Each candlestick consists of a body, and shadows, also called wicks. The shadows tell the traders what were the opening, closing, highest, and lowest rices within a specific timeframe.
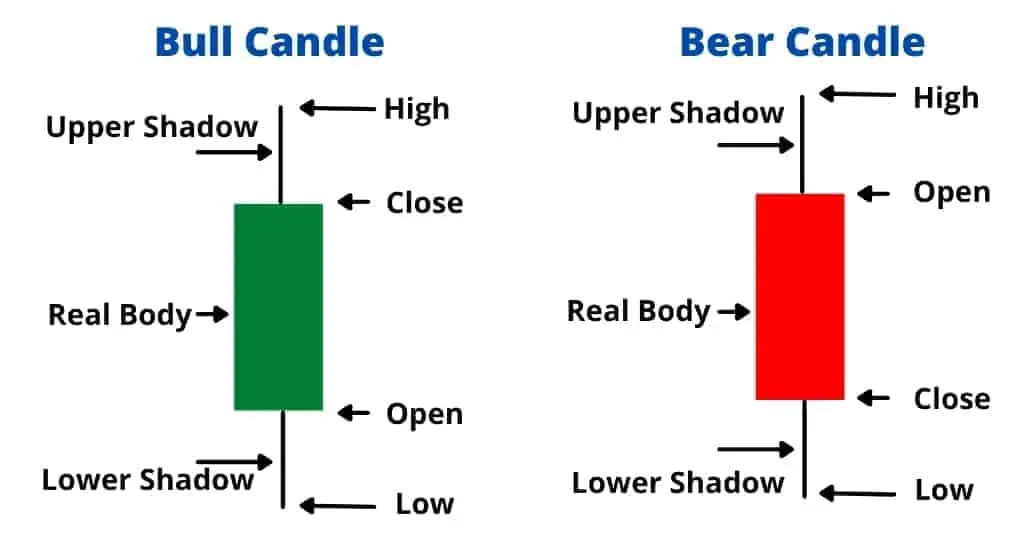
These candles traditionally appear in two colors, red and green, though the trading platform may provide other colors as well. A candle that is red is bearish, meaning its opening price is higher than the closing one. Conversely, the green bullish candle has an opening price lower than the closing one.
Example of a Spinning Top Candlestick
Imagine a particularly eventful day in the Bitcoin market. As dawn breaks and traders across the globe begin their day, Bitcoin starts its trading session priced at a steady $30,000. Early market sentiment seems neutral, but as the morning progresses, a sudden influx of positive news regarding cryptocurrency regulations creates a surge of buying interest. This drives Bitcoin's price up to $30,500 by mid-morning.
However, this bullish momentum doesn't go unchallenged. By early afternoon, large institutional sellers begin offloading their holdings, possibly taking profits or reacting to other macroeconomic factors. This selling pressure counters the earlier bullish sentiment, pushing Bitcoin's price down to a low of $29,500.
Throughout the day, various external factors continue to play their part. Social media buzz, influential tweets, and changing trader sentiment contribute to the price's changes. Speculators jump in, trying to capitalize on the intraday volatility, while long-term holders watch cautiously, gauging the market's direction.
As the trading day nears its end, many expect a significant price movement given the day's volatility. However, there is a surprising calm. Perhaps influenced by a mix of late-day news releases and traders squaring off their positions, Bitcoin's price begins to stabilize. By the time the market closes, Bitcoin finds itself trading at a price remarkable close to where it started, settlement at around $30,050.
This entire day's activity, when plotted on a candlestick chart, results in the formation of a spinning top candlestick. The slender body of the candle, representing the narrow range between the opening and closing prices, is dwarfed by the long shadows on either side, which capture the day's high and low prices.
Limitations of Spinning Top Candles and Strategies to Mitigate Them
Every technical indicator, including the spinning top candlestick, comes with its set of limitations. One of the primary challenges with the spinning top is its inherent ambiguity. While it signals market indecision, it doesn't provide clear directional cues. To enhance its efficacy, financial analysts and traders often integrate it with other technical tools.
By combining the spinning top with indicators like moving averages, Fibonacci retracement levels, or the Relative Strength Index (RSI), traders can glean more definitive insights into market direction. Additionally, the spinning top's neutrality means it requires context. Its appearance after a bullish trend might indicate potential bearish reversal, while its formation post a bearish trend could suggest a bullish turnaround.
Is a Spinning Top Candlestick Bullish or Bearish?
At its core, the spinning top candlestick is neutral. However, its interpretation can be influenced by the prevailing market trend. When a bullish spinning top forms after a pronounced downtrend, it can be perceived as a potential indicator of an upward shift.
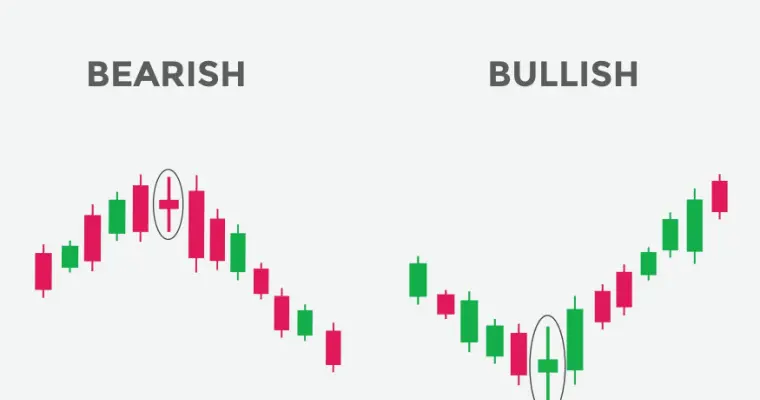
On the other hand, a bearish spinning top, observed after a sustained uptrend, can be a sign of an impending bearish turn. In this scenario, the buying pressure could be diminishing, paving the way for sellers to dominate.
The context in which the spinning top appears is crucial for its interpretation. Its position relative to other candles, combined with other technical indicators, can provide a clearer picture of the market's direction.
We will stop a bit more at each type in our following guide.
How to Trade Crypto Using the Spinning Top Candlestick
Let’s take a closer look at the types of the spinning top patterns and the related strategies to use in your trading routine.
The Anatomy of the Spinning Top in Cryptocurrency
As it was mentioned, the spinning top candlestick is characterized by its small body. In the crypto market, it signifies a proximity between the traded cryptocurrency opening and closing prices. The long shadows of the candle represent the high and low prices of the trading. These wicks indicate that both bears and bulls are very active, none of them taking the lead on the market.
The formation of a spinning top in a Bitcoin chart, for instance, indicates a session where, despite significant price swings (as represented by the long shadows), the market couldn't decide on a definitive direction, closing near where it started.
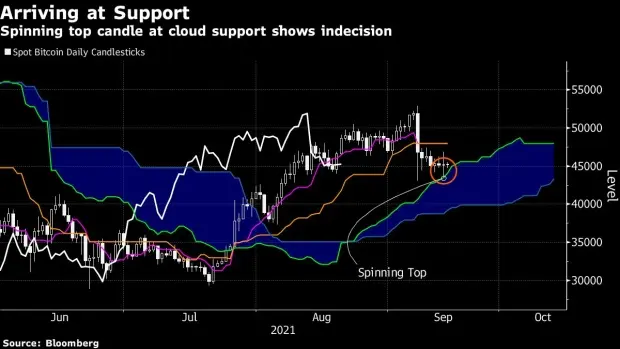
Here is for example, a spinning top spotted by Bloomberg on September 14, 2021:
Deciphering Market Sentiment with the Spinning Top
The primary value of the spinning top lies in its ability to convey market sentiment.
- Potential bearish trend: if a spinning top emerges amidst a series of green, upward-trending candles, it might be an early indication that the bullish momentum is facing resistance. While buyers have been in control, the spinning top suggests that sellers are starting to push back, potentially signaling a slowdown or even a reversal of the uptrend.
- Potential bullish trend: conversely, when a spinning top forms during a downward trend, it can be interpreted as a sign that the sellers are losing their grip. The bears, which had been driving prices down, are now facing resistance from buyers, indicating a potential shift in momentum.
Bullish Spinning Top (Bottom) Candlestick Pattern
When this pattern emerges at the tail end of a downtrend, it can be a sign of a potential bullish resurgence. The appearance of the spinning top in this context suggests that the bears are losing their grip on the market, and a bullish sentiment might be on the horizon.
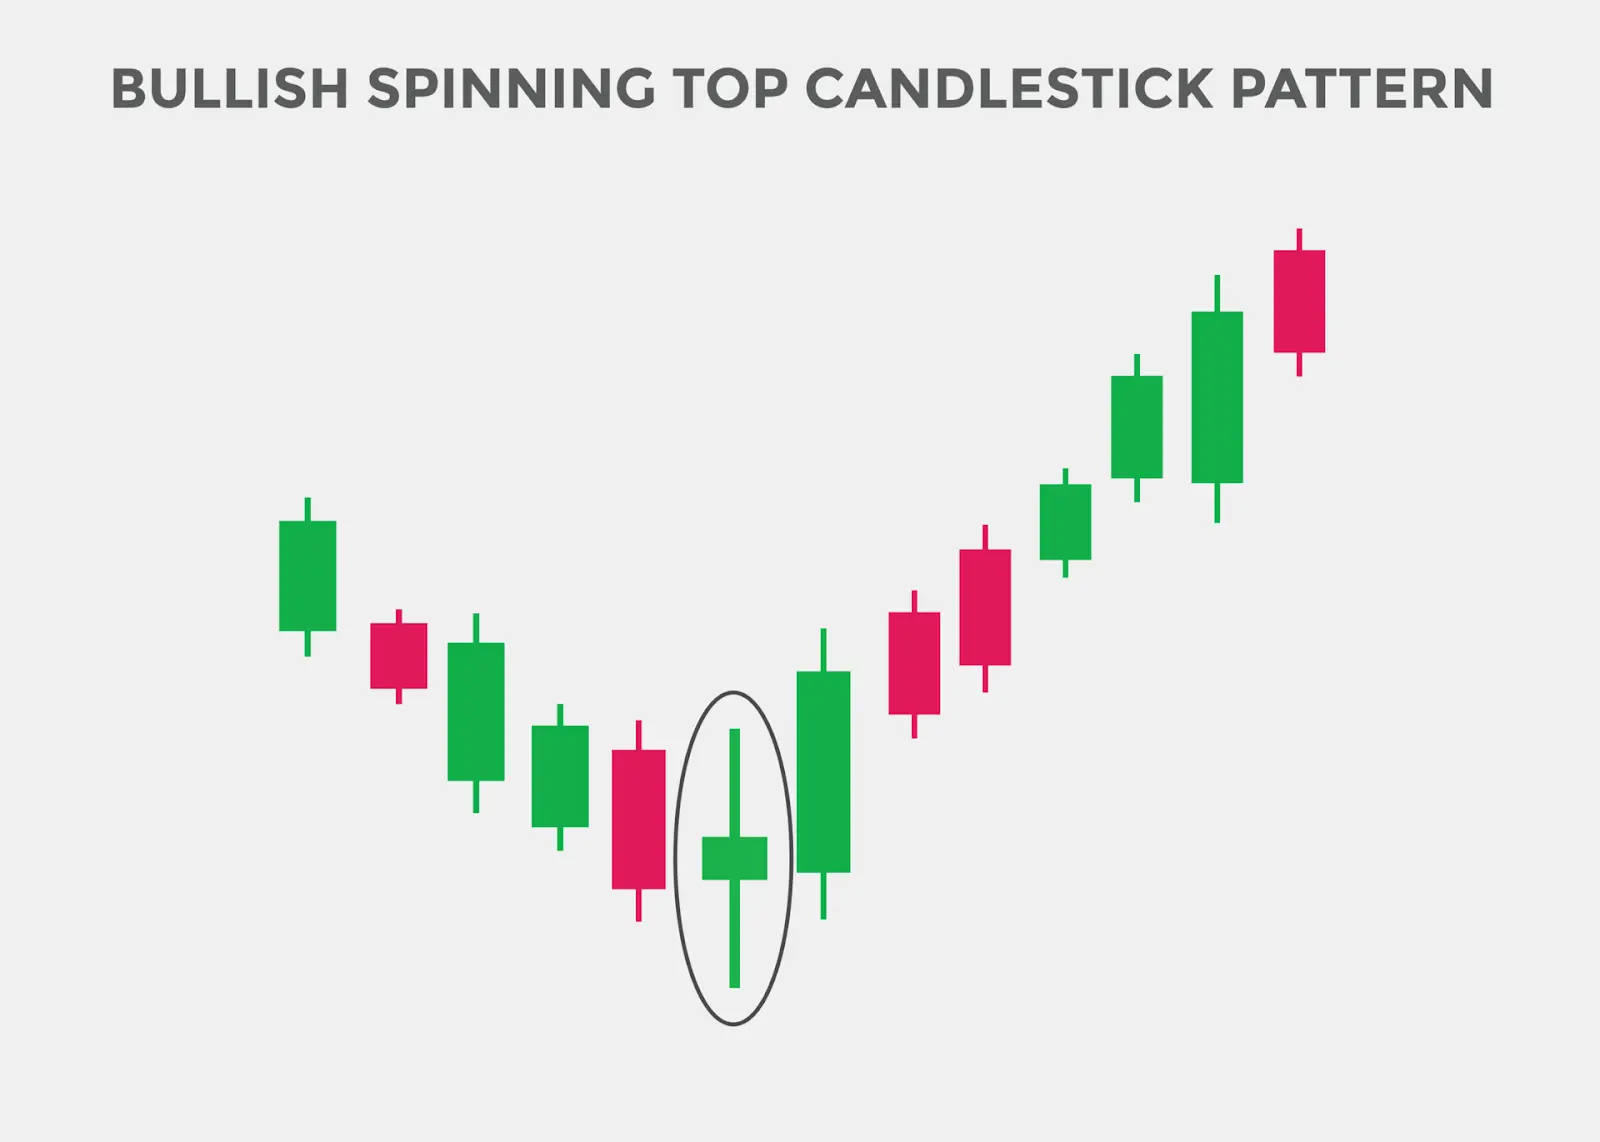
Traders, equipped with this insight, can consider initiating long positions, especially if other technical indicators corroborate the bullish outlook. For instance, if the spinning top is followed by a series of bullish candles or if it appears near a support level, it could strengthen the case for a bullish reversal.
Bearish Spinning Top Candlestick Pattern
Conversely, when this pattern is spotted after a robust uptrend, it can be an indicator of a potential bearish reversal. The spinning top, in this scenario, hints that the bulls might be running out of steam, and a bearish sentiment could be taking root.
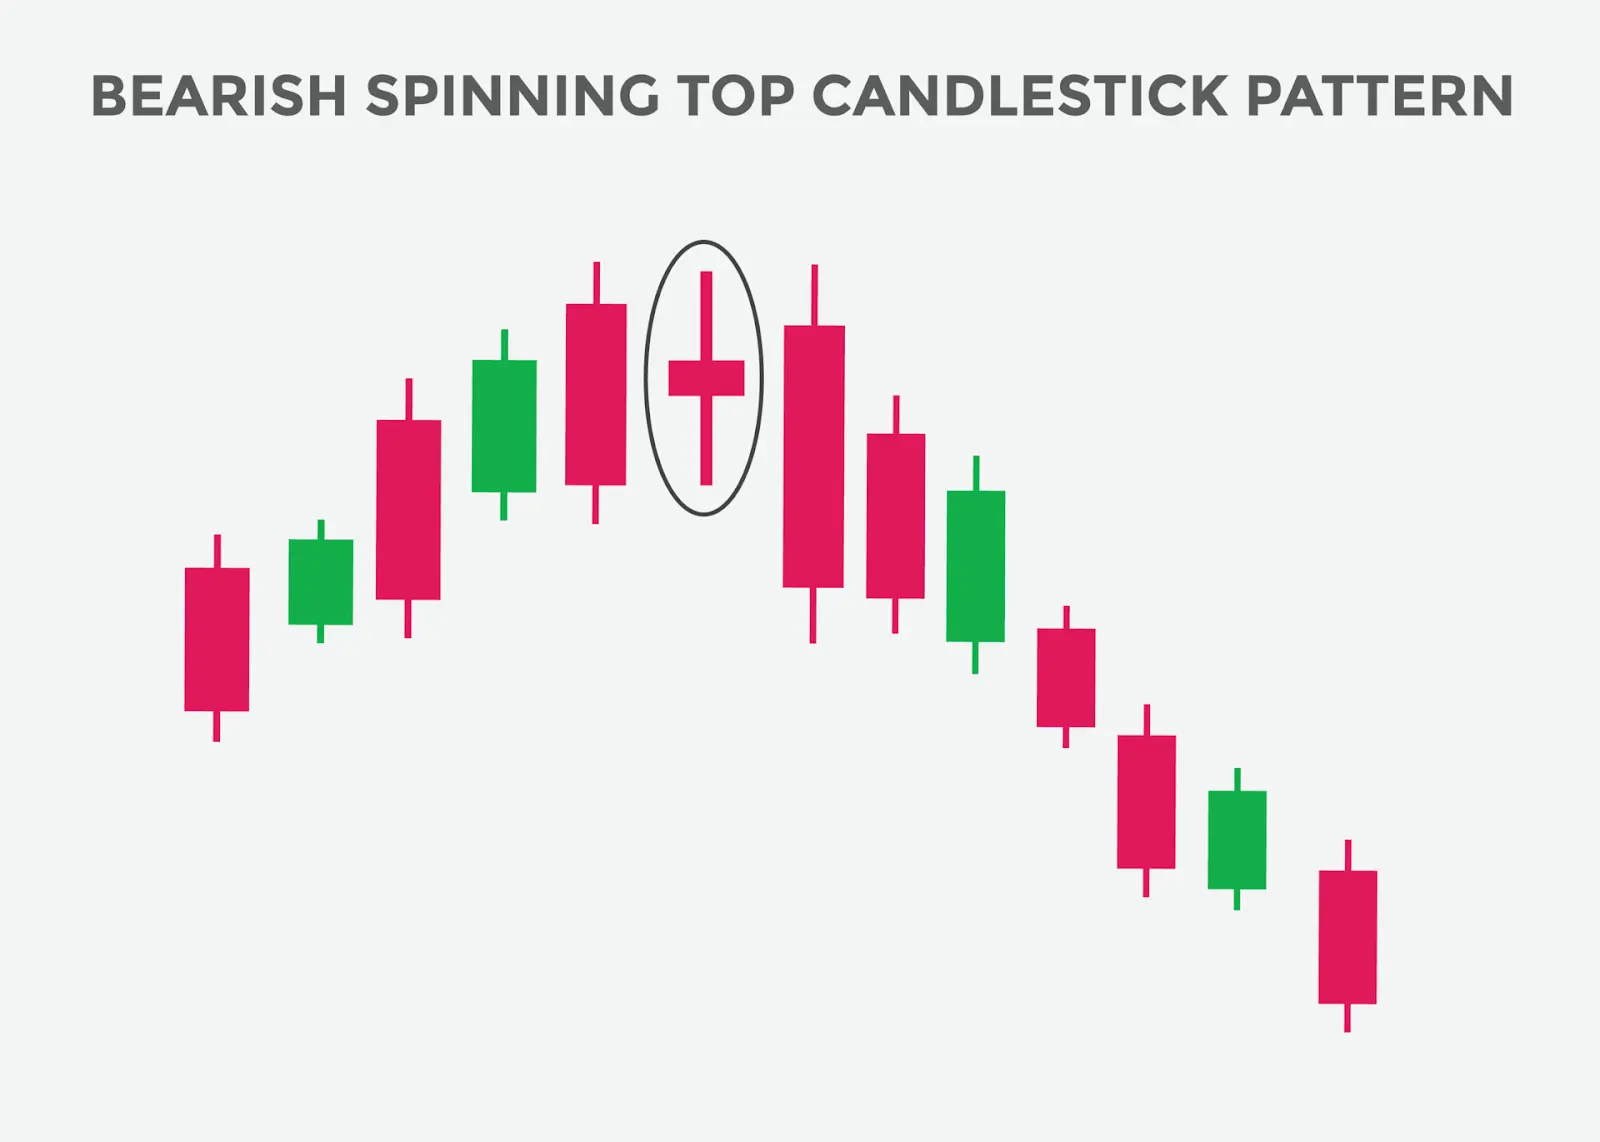
Traders, armed with this knowledge, can contemplate short positions, particularly if other technical tools validate the bearish perspective. If the spinning top is followed by a series of bearish candles or appears near a resistance level, it could further solidify the case for a bearish turn.
Strategic Trading Using the Spinning Top
For cryptocurrency traders, the spinning top can serve as a crucial decision point:
- Entry points: a spinning top, when observed after a prolonged trend (be it bullish or bearish), might suggest a potential trend reversal. Traders could consider this as an opportunity to enter the market, anticipating a new trend.
- Exit points: for those already holding positions, the appearance of a spinning top might be a cue to consider taking profits, especially if other technical indicators corroborate the potential for a trend shift.
- Setting stop-losses: given the indecisive nature of the spinning top, traders might also use its formation as a basis to set stop-loss levels, ensuring they have a risk management strategy in place should the market move against their expectations.
Enhancing Analysis with Supplementary Tools
While the spinning top is a powerful indicator on its own, its predictive accuracy can be enhanced when used alongside other technical tools:
- Relative Strength Index (RSI). If the RSI shows overbought conditions when a spinning top forms after a bullish trend, it might strengthen the case for a potential bearish reversal, like on the picture below:
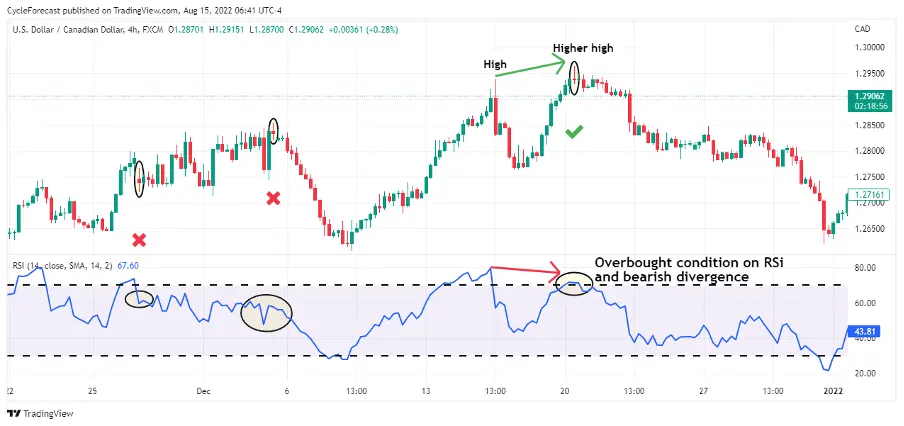
Similarly, an oversold RSI combined with a spinning top during a bearish trend could indicate a bullish turnaround.
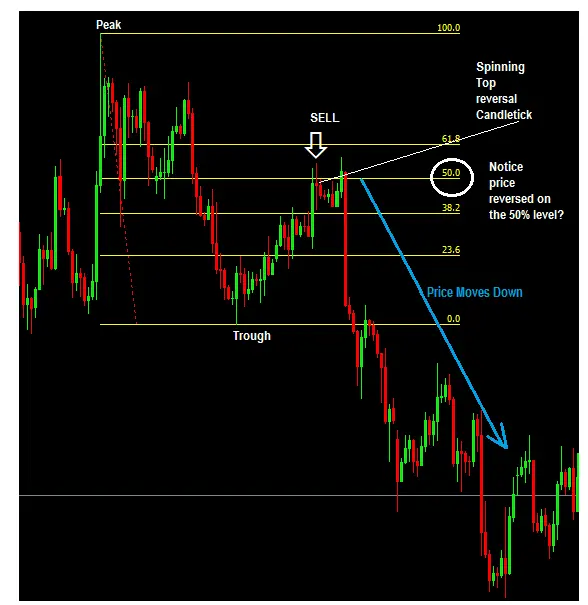
- Fibonacci Retracement Levels. The position of the spinning top relative to key Fibonacci levels can offer added insights. For instance, a spinning top forming near a significant retracement level might suggest that the price is finding support or resistance at that level. Here is an example of spinning top spotted together with the price reaching the 50% Fibonacci level:
Spinning Top vs. Doji
Both the spinning top and the doji patterns are indicative of a period of indecision in the market, but they convey this message in slightly different ways.
Unlike spinning top, doji is a candlestick pattern that is characterized by its almost non-existent body, which means that the opening and closing prices for the asset were nearly identical or very close during a specific trading period. This unique structure of the doji signifies a momentary equilibrium in the market. It's as if buyers and sellers have reached a temporary standstill, with neither side able to assert dominance. This balance can arise from various factors, such as uncertainty about future price movements, impactful external news events, or a period of consolidation after significant price swings.
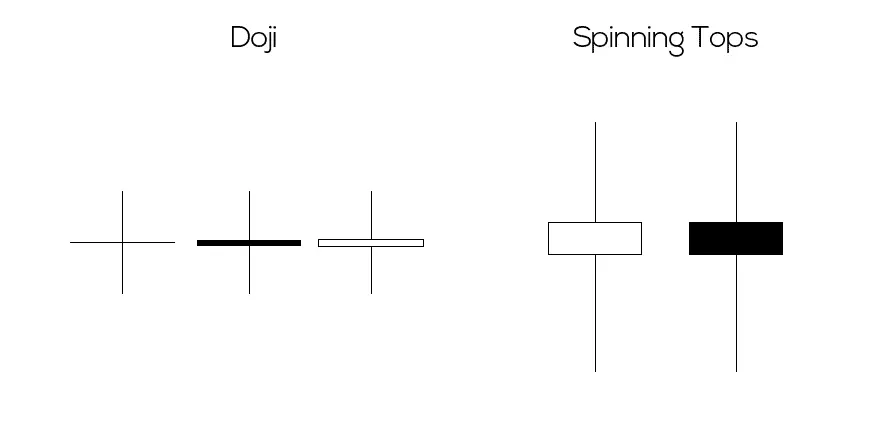
On the other hand, the spinning top, while also indicative of market indecision, has a slightly different structure. It possesses a more pronounced body compared to the doji, albeit still small relative to its shadows. The appearance of a spinning top in a price suggests chart a market that is grappling with direction. There's a clear tug-of-war happening between buyers and sellers, but neither side has managed to gain a significant upper hand.
Pros and Cons of Spinning Top Candlestick Pattern
Pros:
- The spinning top candle is relatively easy to identify, even for novice traders.
- It is a versatile pattern, offering insights into potential trend reversals or continuations.
- When combined with other technical tools, it can provide a more comprehensive view of the market's direction.
Cons:
- On its own, the spinning top can be ambiguous, requiring additional context for accurate interpretation.
- It does not provide explicit entry or exit signals, necessitating the use of other technical indicators for trade execution.
The Bottom Line
The spinning pattern, with its distinctive appearance and implications, is an invaluable tool in the trader's toolkit. While it primarily signals market indecision, its appearance in specific market contexts can provide insights into potential trend reversals or continuations. However, like all technical indicators, its efficacy is enhanced when used in conjunction with other tools and analysis methods. In the dynamic world of cryptocurrency trading, where volatility is the norm, recognizing and understanding patterns like the spinning top can be the key to successful trading.
FAQ
How Do You Use a Spinning Top Candlestick?
Utilizing the spinning top candlestick effectively requires a combination of observation, context, and corroborative indicators. First and foremost, traders should identify the spinning top on their charts, noting its distinctive small body and long shadows. Once identified, the broader market context becomes crucial. The preceding trend, be it bullish or bearish, can provide insights into potential future movements. For instance, a spinning top appearing after a prolonged downtrend might suggest a weakening of bearish sentiment. However, traders should avoid making decisions based solely on the spinning top. Incorporating other technical indicators, such as moving averages or the RSI, can provide a more comprehensive view, allowing traders to make more informed decisions.
Is a Spinning Top a Doji?
While both the spinning top and the doji are indicative of market indecision, they are distinct patterns with different implications. A doji is characterized by an almost non-existent body, suggesting that the opening and closing prices were nearly identical. This pattern reflects a perfect balance between buying and selling pressures. The spinning top, however, has a discernible body, albeit small, indicating a slight difference between the opening and closing prices. Both patterns highlight market uncertainty, but their appearance in different market contexts can lead to varying interpretations.
What Happens After a Bullish Spinning Top?
A bullish spinning top, often appearing after a downtrend, can be a harbinger of a potential bullish reversal. This pattern suggests that the selling pressure, which dominated the market during the downtrend, might be waning. However, it's essential to note that the spinning top, on its own, is not a definitive bullish signal. Traders should look for corroborative signs, such as a subsequent bullish candle or supportive readings from other technical indicators, before considering a long position. Additionally, factors like trading volume during the formation of the spinning top, or its proximity to key support levels, can further influence its bullish implications.
*This communication is intended as strictly informational, and nothing herein constitutes an offer or a recommendation to buy, sell, or retain any specific product, security or investment, or to utilise or refrain from utilising any particular service. The use of the products and services referred to herein may be subject to certain limitations in specific jurisdictions. This communication does not constitute and shall under no circumstances be deemed to constitute investment advice. This communication is not intended to constitute a public offering of securities within the meaning of any applicable legislation.

