What Is a Doji Candle Pattern?
In the intricate world of technical analysis, the doji candlestick pattern is an essential tool. Being a type of Japanese candlestick pattern, it provides a snapshot of market sentiment at any given moment. Especially in the unpredictable realm of cryptocurrency, understanding the nuances of the doji can be invaluable.
Essentially, doji is a reflection of the tug-of-war between buyers and sellers, with neither side gaining a clear advantage. This equilibrium is a crucial indicator for traders and investors alike, as it can signal potential shifts in market momentum.
Furthermore, the doji's appearance on a chart can often be the precursor to significant price movements, making it a tool of paramount importance for those looking to optimize their trading strategies.
What Is a Doji?
At its core, a doji is a visual representation of equilibrium in the market. It signifies a period where the opening and closing prices of an asset, such as Bitcoin, are almost identical. It means that despite potential price fluctuations during the trading period, the asset began and ended at nearly the same price point.
Such a scenario can arise due to various factors, including external news events, shifts in market sentiment, or significant buy and sell orders at specific price levels. The formation of a doji can be seen as the market taking a pause, reassessing its direction before making the next move.
Key Takeaways
- Doji candlestick patterns are synonymous with market indecision.
- Their appearance can hint a potential price reversals, especially when confirmed by other indicators.
- There's a spectrum of doji candles, each conveying its unique message.
- In the realm of cryptocurrency, especially Bitcoin, understanding doji patterns can be the difference between a profitable trade and a loss. Given the volatile nature of cryptocurrencies, the ability to spot potential reversals or continuations in price trends can be invaluable.
Understanding Market Makers
Market makers, often institutions or individuals, are the key to ensuring liquidity in the market. Their primary role is to buy and sell assets, ensuring that trading can occur smoothly and efficiently. When a doji candlestick materializes, it often mirrors the indecision of these pivotal players, suggesting a potential shift in market dynamics.
Market makers, with their vast resources and deep pockets, can influence price movements. A doji can indicate a period where these influential players are reassessing their strategies, leading to potential price shifts in the near future. It's also worth noting that market makers, with their ability to provide liquidity, can sometimes use their influence to create false signals in the market. Thus, it is even more crucial for traders to use a combination of indicators when making trading decisions.
How Does a Doji Candle Work?
A doji candlestick emerges as a result of equilibrium in market forces. When observed, it signifies that the opening and closing prices for the asset during a specific trading period are nearly identical. This balance indicates that neither the buyers (bullish camp) nor the sellers (bearish camp) have managed to secure a dominant position. Such a scenario can be attributed to various factors.
For instance, there might be prevailing uncertainty due to impending regulatory announcements affecting the cryptocurrency market. Alternatively, traders might be anticipating a significant market event or news before deciding on a clear direction. In some cases, external macroeconomic factors or global events might lead to a wait-and-see approach among market participants.
Regardless of the underlying cause, the appearance of a doji is akin to a momentary pause in a musical composition—a brief period of reflection and anticipation. It's a signal that the market is in a state of indecision, and a significant move could be on the horizon. Traders often view the doji as a precursor to potential price swings, making it crucial to observe subsequent candle formations closely for confirmation of the market's next direction.
Using a Doji to Predict a Price Reversal
The appearance of a doji can be a precursor to a price reversal. For instance, if Bitcoin has been on a relentless upward trajectory and suddenly a doji materializes, it might be an indication of a potential downturn. Conversely, in a downtrend, a doji might suggest an impending upward shift. However, it's essential to note that while a doji can signal a potential reversal, it's not a guarantee.
Other factors, such as volume, other technical indicators, and external news events, can influence the eventual outcome. For instance, if a doji appears during a period of low trading volume, its significance might be diminished. On the other hand, a doji that forms during a period of high trading volume can be a more potent signal of a price reversal.
What Does a Doji Tell Investors?
For those with a vested interest in the market, a doji is akin to a weather vane, hinting at possible changes in market direction. It's a clear sign that the prevailing trend, be it upward or downward, might be running out of steam. However, seasoned investors know the importance of seeking confirmation from subsequent price actions or other technical indicators before making decisions.
For instance, if a doji is followed by a large bullish candle with significant volume, it could confirm a trend reversal. Similarly, if a doji is followed by a large bearish candle, it might signal a continuation of the downtrend.
Types of Doji Patterns and How to Trade Them
Neutral Doji
The neutral doji consists of a candlestick with almost invisible body and the upper and lower wicks around the same length. It suggests that there's a perfect equilibrium between buying and selling pressures. In the volatile world of Bitcoin trading, this pattern could be interpreted as traders being on the fence, uncertain about the asset's next move.
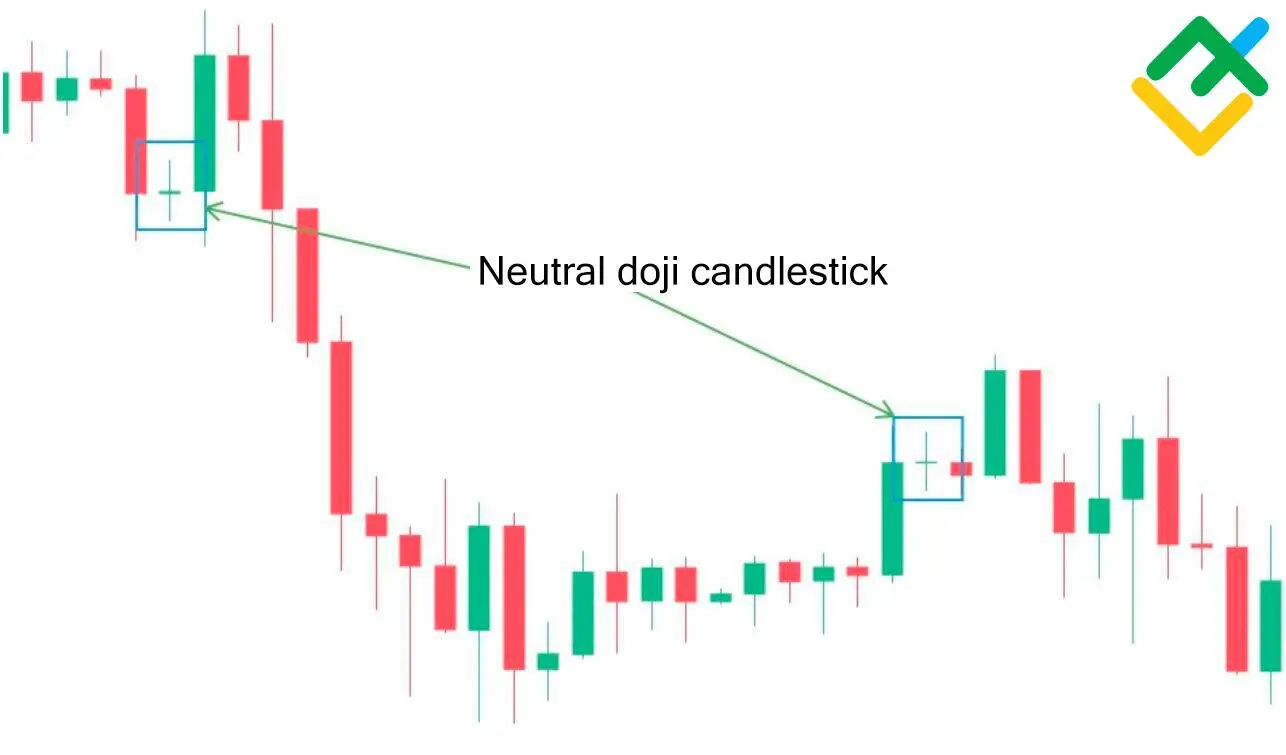
Trading a neutral doji requires patience. It's often best to wait for subsequent candles to confirm the market's direction before making a move. For instance, if a neutral doji is followed by a bullish candle, it might be a good time to consider entering a long position. On the other hand, if it's followed by a bearish candle, it might be wise to consider shorting the asset or exiting a long position.
Long-legged Doji
Characterized by its pronounced upper and lower shadows, the long-legged doji candlestick is indicative of a market uncertainty. It suggests that while there were significant price swings during the trading period, the asset closed near its opening price.
Here’s the picture of the long-legged doji in comparison to the neutral one:
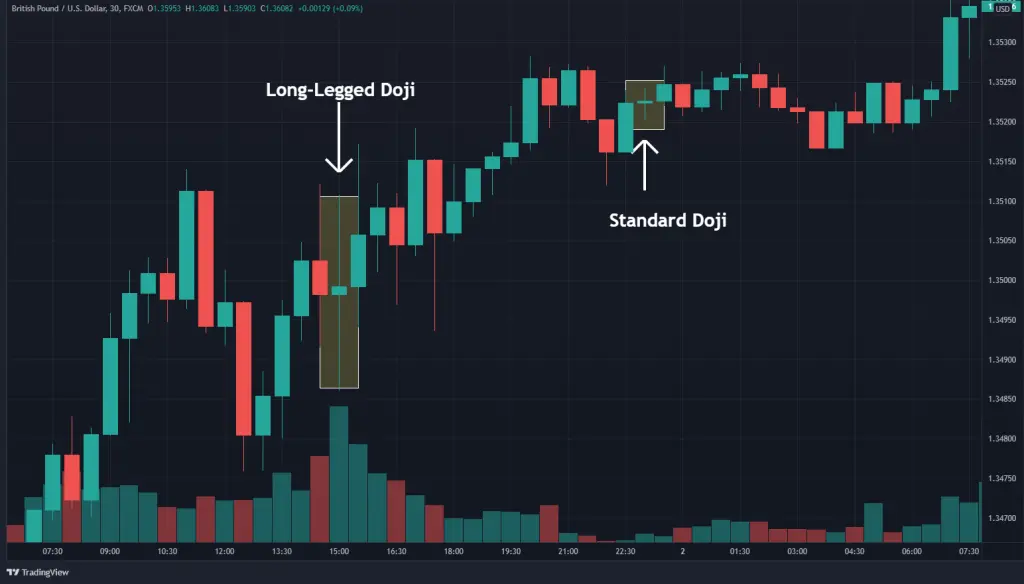
This pattern can be particularly useful in volatile markets, signaling potential trend exhaustion. Traders might consider tightening their stop losses or taking partial profits when they spot this pattern.
Dragonfly Doji
This pattern, with its elongated lower shadow, is a testament to the resilience of buyers. It indicates that despite an initial price dip, there was a resurgence of buying interest, pushing the price back up.
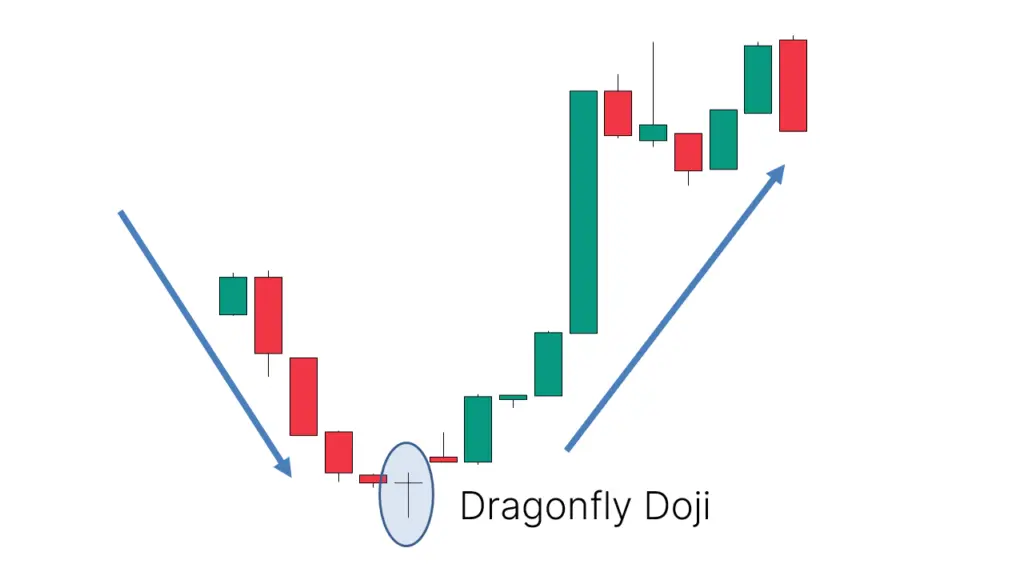
The pattern is called so due to its resemblance to the body of a dragonfly:
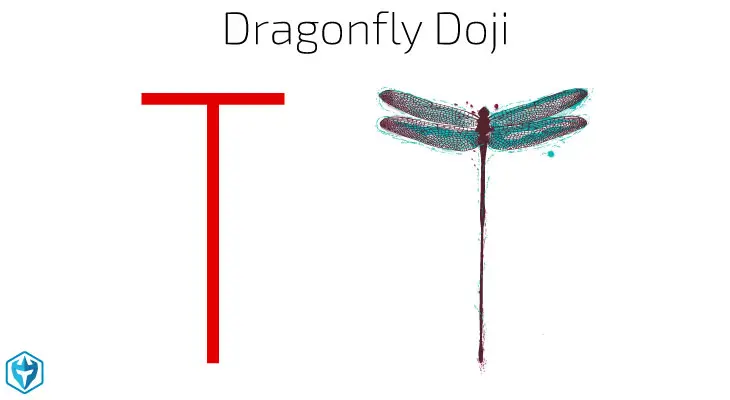
For Bitcoin, if the price momentarily dips to $29,000 but manages to claw its way back to $30,000 by close, a dragonfly doji would be in the offing. This pattern can be a bullish sign, especially if it appears at the end of a downtrend. Traders might consider this as a potential buying opportunity, especially if other indicators align favorably.
Gravestone Doji
The gravestone doji, with its extended upper shadow, tells a tale of sellers wresting control from buyers.
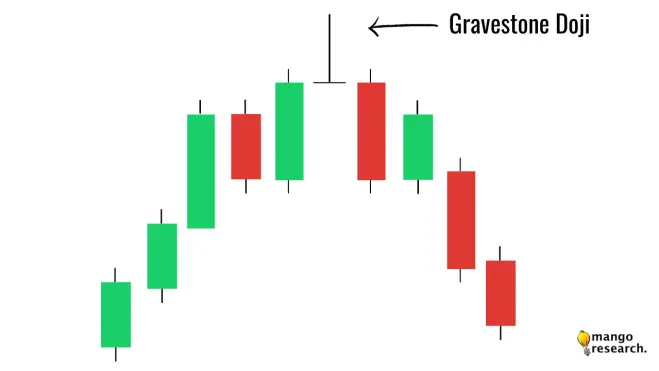
It suggests that while the asset experienced a surge in price, it met with significant selling pressure, causing it to retreat to its opening price.
In the context of Bitcoin, if the price surges to $31,000 but faces resistance and falls back to $30,000 by close, a gravestone doji would form. This pattern can be a bearish signal, especially if it appears at the end of an uptrend. Traders might consider this as a warning sign and potentially look to take profits or set tighter stop losses.
Limitations of a Doji
No technical indicator is infallible, and the doji is no exception. While it offers a glimpse into market sentiment, it's not a standalone tool. It's imperative to corroborate its signals with other indicators to gain a more accurate picture of the market sentiment.
For instance, a doji appearing on low trading volume might not be as significant as one that forms on high volume.
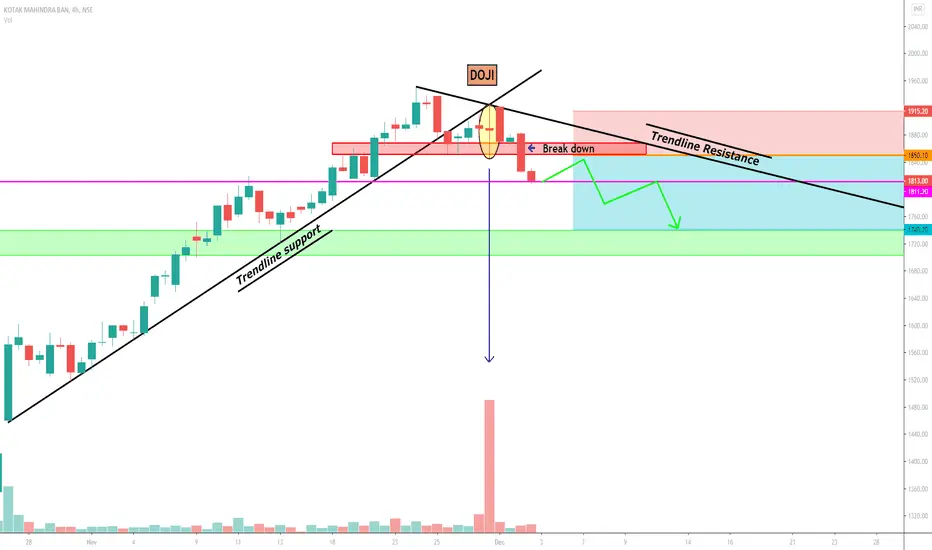
Additionally, the broader market context, such as prevailing trends and external news events, can influence the interpretation of a doji. Traders should always be cautious and avoid making decisions based solely on a single candlestick pattern.
Doji Example
Scenario I
Consider a scenario where Bitcoin, the leading cryptocurrency, has been experiencing a consistent rise. Over a span of several weeks, its value has surged from $25,000 to $30,000. This upward trend reflects a strong bullish sentiment, possibly influenced by positive market news, increased institutional adoption, or favorable regulatory stances.
Amidst this optimistic environment, a gravestone doji suddenly appears on the daily chart. It is characterized by its long upper wick and minimal body at the lower end. A gravestone doji suggests that during the day, while buyers initially pushed the price up, sellers took control by the end, bringing the price back near its opening level.
Such a pattern can be indicative of potential selling pressure on the horizon, signaling that the bullish momentum might be waning.
However, the story doesn't end here. The subsequent candle's formation is crucial in determining the market's direction. If the following day results in a bullish candle, with a prominent green body, it could negate the bearish implication of the gravestone doji.
This sequence emphasizes the importance of confirmation in technical analysis. A single candlestick pattern, while insightful, should be corroborated with additional data before drawing definitive conclusions.
Scenario II
On the flip side, imagine a contrasting situation where Bitcoin has been on a downward trajectory, falling from $35,000 to $30,000. Factors such as negative media coverage, regulatory challenges, or macroeconomic concerns might be influencing this bearish phase.
In this declining market, a dragonfly doji forms with its pronounced lower wick and tiny body at the upper end. The pattern indicates that despite sellers driving the price down initially, buyers managed to pull it back up by the close, reflecting potential buying interest at these lower levels. Such a formation can hint at a possible upward reversal in the offing.
Yet, as with the previous example, a good judgment is essential. The emergence of the dragonfly doji, while suggestive of a bullish turnaround, requires further validation. Traders should keenly observe the next candle or set of candles for confirmation. A subsequent bullish candle would strengthen the case for a trend reversal, while a bearish continuation would advise caution.
In essence, while the doji serves as a valuable tool in gauging market sentiment, its true efficacy lies in its interpretation alongside subsequent price movements and broader market context.
What is the Difference between a Doji and a Spinning Top?
Both patterns are precursors of market indecision. However, while a doji has an almost non-existent body, a spinning top, though small, has a noticeable body, indicating some difference between the opening and closing prices.
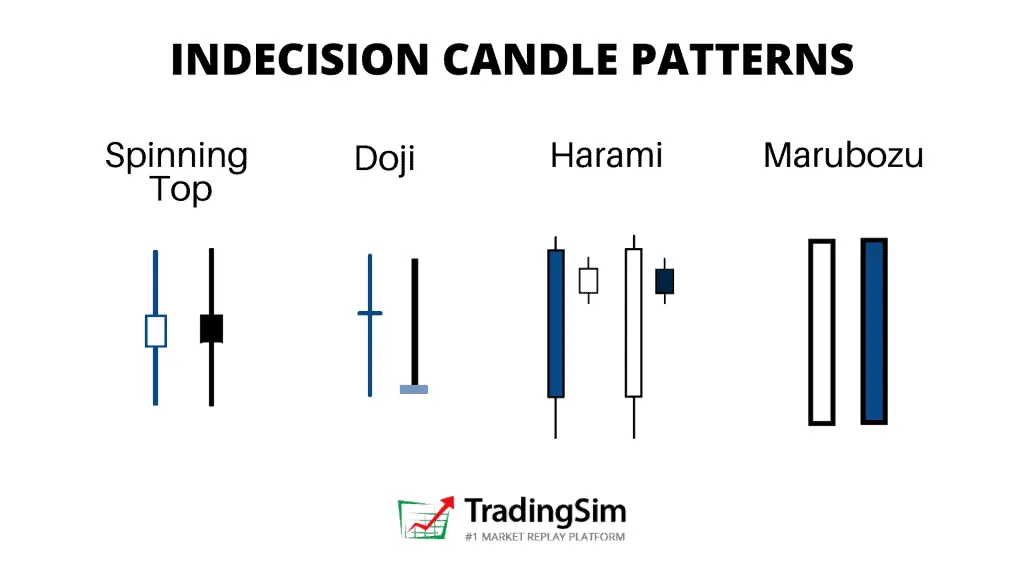
The spinning top suggests that there was more of a tug-of-war between buyers and sellers during the trading period, while a doji suggests a near-perfect balance. It's essential to understand the subtle differences between these patterns to make informed trading decisions.
Advantages of Using the Doji Candlestick in Technical Analysis
The doji, with its ability to signal potential price reversals, can be a potent tool in a trader's arsenal. It offers an early warning system, allowing traders to strategize their entries and exits more effectively. Here are some advantages:
- Timely signals. Doji patterns often appear before significant price movements, giving traders a heads-up.
- Versatility. The patterns can be used across various time frames, from intraday charts to weekly or monthly charts.
- Complement to other indicators. Doji patterns can be used alongside other technical indicators, enhancing the accuracy of trading signals.
- Risk management. Recognizing a doji can help traders set stop-loss levels, protecting their investments.
- Enhanced decision-making. The appearance of a doji can provide traders with a clearer perspective on market sentiment, aiding in more informed decision-making.
How Reliable Is the Doji Candle Pattern?
While the doji is a valuable tool, its reliability is contingent on the broader market context. It's most effective when used in conjunction with other technical indicators, providing a more holistic view of the market. For instance, a doji that appears near a significant support or resistance level, backed by high trading volume, can be a more reliable signal than one that forms in isolation.
How Can a Doji Be Used in Cryptocurrency Trading?
In the dynamic world of cryptocurrency, the doji can be a guiding light. With assets like Bitcoin known for their volatility, a doji can offer timely signals, helping traders navigate the choppy waters of crypto trading. Here's how:
- Trend analysis. Given the volatile nature of cryptocurrencies, trends can reverse rapidly. A doji can provide early indications of such reversals, allowing traders to adjust their strategies accordingly.
- Risk mitigation. In the crypto market, where price swings can be drastic, recognizing a doji can help traders set appropriate stop-loss levels, thereby minimizing potential losses.
- Strategic entries and exits. A doji can help traders identify optimal entry and exit points. For instance, a dragonfly doji at the end of a downtrend might indicate a good buying opportunity, while a gravestone doji at the end of an uptrend could suggest it's time to sell or short.
- Enhanced decision-making in volatile markets. Cryptocurrencies are known for their price volatility. A doji can provide clarity in such markets, offering insights into potential price movements.
- Informed long-term investments. For those looking at cryptocurrencies as a long-term investment, recognizing doji patterns can help in timing their investments better, ensuring they get the best value for their money.
Conclusion
The doji candlestick pattern, with its various forms and interpretations, remains a cornerstone in technical analysis. Its ability to provide insights into market sentiment makes it an invaluable tool, especially in markets as volatile as cryptocurrencies. While it offers a plethora of advantages, traders must remember that no single tool or indicator offers a complete picture.
The key lies in combining the insights from the doji with other technical and fundamental analysis tools to make well-informed trading decisions. In the ever-evolving world of cryptocurrency, where fortunes can be made or lost in a matter of minutes, understanding and effectively utilizing the doji pattern can be the key to successful trading.
FAQ
What Does a Doji Candle Tell You?
A doji candle, meaning a period of indecision in the market. It suggests that during the trading period, neither the buyers nor the sellers could gain a decisive advantage, leading to an almost equal opening and closing price.
What Are the 4 Types of Doji?
The four primary types of doji candles are the neutral doji, long-legged doji, dragonfly doji, and gravestone doji candle. Each type provides unique insights into market sentiment and potential future price movements.
Is a Doji Bullish or Bearish?
A doji, in isolation, is neither bullish nor bearish. It represents market indecision. However, its interpretation can lean either way, depending on the preceding price action and the broader market context. For instance, a dragonfly doji after a prolonged downtrend can be considered bullish, while a gravestone doji after an extended uptrend might be viewed as bearish.
*This communication is intended as strictly informational, and nothing herein constitutes an offer or a recommendation to buy, sell, or retain any specific product, security or investment, or to utilise or refrain from utilising any particular service. The use of the products and services referred to herein may be subject to certain limitations in specific jurisdictions. This communication does not constitute and shall under no circumstances be deemed to constitute investment advice. This communication is not intended to constitute a public offering of securities within the meaning of any applicable legislation.


