Bitcoin Price Prediction 2023 - 2050 - Will BTC Price Go Up?
What is Bitcoin?
Bitcoin, fondly called Digital Gold, is a digital asset invented by Satoshi Nakamoto. Transactions are verified by network nodes through cryptography and recorded in a dispersed public ledger called a blockchain. It is the first and most well-known cryptocurrency, and its success has spawned other digital currencies and blockchain projects.
Bitcoin is unique in that there are a finite number of its coins: 21 million. New bitcoins are created as a reward for miners who protect and validate transactions on the network. This process is known as mining and involves solving complex mathematical problems to validate transactions and secure the network. Miners are rewarded with newly created Bitcoins and transaction fees paid by users. This incentive system ensures the network remains secure and functional.
Bitcoin Overview
Bitcoin is often lauded for its potential to revolutionize how we interact with the global financial system. It offers a way to transact without the need for a trusted third party, which is a fundamental shift in how we think about money and finance.
By creating a decentralized network, it has eliminated the need for central intermediaries like banks or governments. This is particularly important in regions where the financial system is less developed or where people do not have access to traditional banking services. This could potentially lead to lower transaction fees and reduced barriers to entry, particularly for those in developing countries.
History of Bitcoin
Bitcoin’s existence dates back to 2008 when a pseudonym person, Satoshi Nakamoto, created a whitepaper for a new model of digital currency. This whitepaper, titled "Bitcoin: A Peer-to-Peer Electronic Cash System", outlined the concept of Bitcoin and how it would work. It was published online and quickly gained attention from the tech community.
It was not until 2009, months after the global crises happened, that the first block was mined, and the digital currency economy was born. This first block, known as the genesis block, contained a message from Nakamoto referencing the financial crisis, highlighting the need for a new, decentralized financial system.
2010: The first real-world Bitcoin transaction, two pizzas for 10,000 Bitcoins, symbolized a grassroots movement. It wasn't just a trade; it was a statement that Bitcoin had real-world value.
2011-2012: As Bitcoin reached parity with the US dollar, it began to attract a diverse group of enthusiasts. From libertarians seeing it as a means to decentralize wealth to tech enthusiasts drawn to its innovative blockchain technology, Bitcoin was more than a currency; it was a revolution.
2013: With the it value touching $100, Bitcoin cafés and ATMs started popping up worldwide. It wasn't just an online phenomenon; it was entering the physical world, challenging traditional notions of currency.
2017: The meteoric rise to nearly $20,000 was a reflection of a society increasingly disillusioned with traditional financial systems. The ICO boom represented a new way for projects to get funding, bypassing traditional gatekeepers.
2018: The crash that followed was a societal reckoning, questioning the very fundamentals of a decentralized currency.
2019-2020: As Bitcoin matured, it started to find its place in the broader societal narrative. From being a tool for remittances in countries with strict capital controls to being a voice against authoritarian regimes, Bitcoin was no longer just a currency; it was a symbol of resistance.
2021: The global pandemic highlighted the fragility of global systems. Bitcoin, with its decentralized nature, emerged as a potential hedge against traditional market volatilities, further embedding its significance in societal discussions.
2022-2023: Bitcoin's integration into mainstream industries wasn't just about adoption; it was a testament to its resilience. From being dismissed as a "fad" to being recognized as a legitimate financial asset, Bitcoin's journey was a reflection of changing societal attitudes towards decentralization and autonomy.
Bitcoin vs Fiat Currencies
One question that has lingered on in the crypto space is the type of relationship that exists between Bitcoin and fiat currency. Fiat currency is government-issued money which value is derived from the trust and confidence of the people who use it. Some analysts believe Bitcoin will replace the Dollar as the global currency, while others opine that it will only act symbiotically to improve the ease of currency exchange and globalization.
There are also those who believe that Bitcoin and other cryptocurrencies will coexist with fiat currencies, each serving different purposes and catering to different segments of the market. Irrespective of which side you are on, there are a few things that give Bitcoin an advantage over fiat currencies, both as a medium of exchange and as a store of value. They include:
- Lower transaction costs: Sending money through Bitcoin is substantially cheaper than sending money through banks or traditional payment processors like Paypal. There is also no extra or hidden fee attached to sending Bitcoins.
- Accessibility: There is no discrimination on who can use Bitcoin network. In reality, anyone with internet connection is able to interact with the network without having to submit any personal information.
- Transparency: Bitcoin transactions are stored on a digital ledger. This makes them transparent to everyone and increases trust between parties.
What Affects the Value of Bitcoin?
Scarcity Level
There will only be 21 million BTC mined, and with the number of lost private keys, Bitcoin will experience a supply crunch when all the coins have been mined. This fixed supply is in contrast to fiat currencies, which can be printed by governments in unlimited quantities. This has led to concerns about inflation and the devaluation of fiat currencies, making Bitcoin an attractive alternative for those looking to preserve their wealth.
High Bitcoin Adoption
Bitcoin has seen a huge following from several traditional companies and financial institutions. This includes not only investment in Bitcoin as an asset but also the adoption of Bitcoin for payments and transactions. For example, companies like Overstock.com accept Bitcoin as payment for goods and services, and payment processors like Square or Stripe allow merchants to accept Bitcoin payments.
Mining Cycle
Bitcoin bull runs coincide with the Bitcoin halving cycle. This event, which happens approximately every four years, reduces the rewards for mining new blocks by half. The reduction of the new supply of bitcoins creates a scarcity effect that often leads to the upward trend. The most recent halving occurred in May 2020, and the next one is expected in 2024.
Social Media Attention
Online sentiments about 1st cryptocurrency can either drive people to buy or cause them to sell Bitcoin. The herd mentality around Bitcoin is huge, and holders with a substantial online following can cause a spike in volume.
Bitcoin Price Analysis
At the time of writing, BTC was at $25,825. Since March 2023 its price has been fluctuating in a wide range between $24,800 and $31,000. In case the $24,800 is broken, and the bears take over, the prices will likely plunge to the support at $20,000. Conversely, if the bulls surpass the resistance level of $26,833, BTC has potential to accelerate towards the 50-day SMA and stay further in the $24,800–$31,000 range.
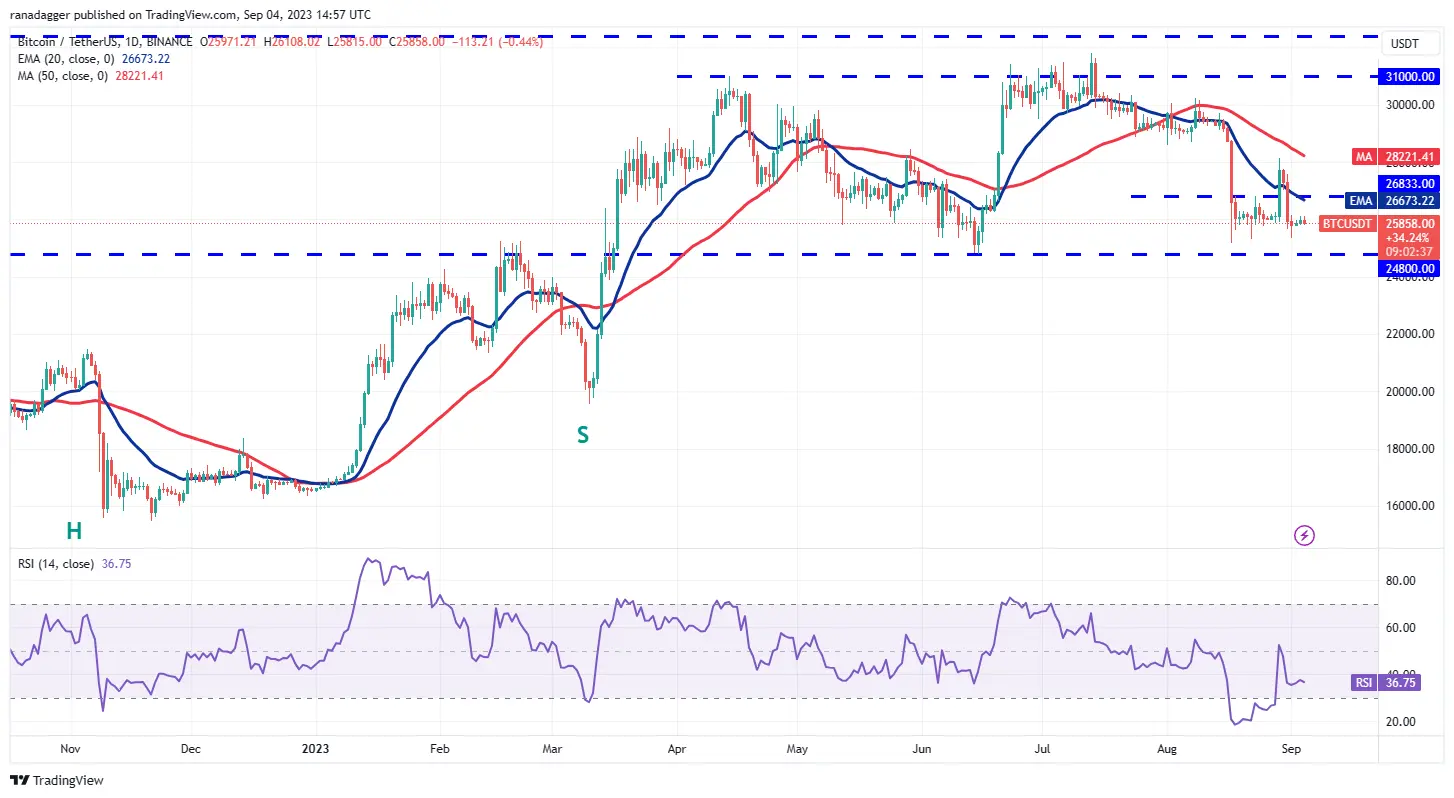
Bitcoin Price Movement in Recent Years
Bitcoin has been quite volatile throughout 2022 and 2023. Here are some key points:
- By the beginning of 2022, Bitcoin had been already falling for a couple of months from around $60,000 in 2021. At the beginning of the year 2022, the BTC price was $47,000 and continued to decline rapidly.
- This decline was attributed to various factors, including regulatory issues, environmental issues associated with bitcoin mining, and a general downturn in the cryptocurrency market.
- After a slight recovery in April 2022, Bitcoin crashed to $20,000 and by the end of the year was already around $16,000.
- At the beginning of 2023, Bitcoin started to struggle to recover again, and as of September 2023, it is trading in a range of $25,000 to $30,000.
Bitcoin Price Prediction 2024
Changelly is betting on Bitcoin being somewhere between the minimum price of $42,722.94 and the maximum price of $55,298.98 in 2024. As explained by their technical analysis experts, the likely outcome will be $47,385.48.
BitcoinWisdom continues its ambitious prediction of Bitcoin with $57,096.23 as a maximum price in 2024. The company believes Bitcoin could shoot up to $64,882.08 and cannot go below $51,905.67
Techopedia expects Bitcoin to start in 2024 at an average of $25,200. The company believes Bitcoin will increase in price in 2024 due to Bitcoin halving, and guesses it might spring up to $31,000 later in the year.
Bitcoin Price Prediction 2025
- The Changelly team’s BTC price prediction 2025 says Bitcoin will trade between $66,282.42 and $78,746.77 in 2025. The team considered volatility and previous value spikes. The average Bitcoin price target 2025 is $68,177.84
- BitcoinWisdom expects Bitcoin projections 2025 to trade between $77,858.50 and $90,834.92 in 2025. They expect BTC to remain more than double its current price and possibly be around the $83,049.07 price range.
- The Techopedia’s forecast puts Bitcoin at an average value of $45,200 in 2025.
Bitcoin Price Prediction 2026
- Considering several analyses, Changelly believes the value of Bitcoin in 2026 would be between $93,741.61 and $112,341.42. The average price is expected to be $97159.51.
- BitcoinWisdom believes Bitcoin will trade close to the $109,001.90 mark in 2026. The estimates are between $103,811.33 and $116,787.75.
Bitcoin Price Prediction 2027
- Changelly does not see any Bitcoin dip in coming years, as its 2027 price predictions signal a 4th consecutive year of upward movement. In 2027, Changelly expects Bitcoin maximum price to be around $134,935.02 and the minimum price at $162,968.88.
- BitcoinWisdom predicts an optimistic, luscious future for Bitcoin. The company believes BTC price in 4 years will begin at $129,764.17 and peak at $142,740.58.
Bitcoin Price Prediction 2028
- Changelly predicts that Bitcoin will trade at around $203,544.96 in 2028. This figure was down after the company made several analyses and research. The predicted average price is $209,136.66.
- BitcoinWisdom sets a price target of $155,717.00 for Bitcoin in 2028. The bull case might increase to $168,693.42, but the company believes Bitcoin will likely average $160,907.57.
Bitcoin Price Prediction 2029
- Considering several analyses, Changelly believes the value of Bitcoin in 2029 would be between $290,544.96 and $354,324.03. The average price is expected to be $300,932.49.
- BitcoinWisdom‘s analysis sees Bitcoin ranging between $181,669.83 and $194,646.25 in 2029.
Bitcoin Price Prediction 2030
- Careful analysis of Bitcoin’s price patterns leads Changelly to believe Bitcoin long-term forecast is between $433,885.92 and $509,921.34 by 2030.
- BitcoinWisdom is very optimistic about Bitcoin’s price in 2030 with its target of $207,622.67, and maxim predicted value of $212,813.23.
- Techopedia has a less optimistic price target for Bitcoin. The Bitcoin price forecast from the site puts Bitcoin in a range between $30,000 and $100,000.
Bitcoin Price Prediction 2040
- Libertex predicts that Bitcoin will trade at around $895,000 in 2040. This figure was down after the company made several analyses and research. However, as the Libertex team says, the exact value will be determined by the state of the global economy and geopolitical conditions.
Bitcoin Price Prediction 2050
- Using Bitcoin's 5-year average return of approximately 22%, Libertex predicts that Bitcoin will trade at around $6,680,000 in 2050. The team corrects itself, however, and states readily that an annualized return of 22% for almost 30 years is impossible. But using the historical average annualized return on investment of the S&P 500, it suggests that BTC could reach a minimum price of $556,000.
Potential Highs & Lows of Bitcoin
Several Factors That Drive Bitcoin Price Boost
Scarcity Level
Bitcoin’s limited supply is one of its unique traits. There will only be 21 million Bitcoins ever created, and currently, only 10% remain to be mined. This scarcity is a fundamental factor that drives the value of Bitcoin. As more people get acquainted with a more convenient way to foster cross-border payments, the demand will outpace supply, creating a scarcity situation. A similar asset where this theory plays out is precious metals
High Bitcoin Adoption
One of the true measures of a cryptocurrency’s potential is not in its price or volatility but in its global adoption. Despite the many bear cases against Bitcoin’s existence, the cryptocurrency has continued to see global adoption from retail and institutional investors. This includes major corporations, small businesses, and individual investors all around the world.
Several financial bodies are incorporating Bitcoin into their payment methods, and funds are beginning to offer some exposure to Bitcoin. Data released from Coinshares show that global Bitcoin adoption increases by an average of 113% yearly. If the statistics continue in this trend, global adoption will positively impact the value of Bitcoin. Analysing Bitcoin’s adoption with the growth of the internet in its early days, one can also infer that Bitcoin is experiencing a greater adoption rate than the internet.
Social media
The level of social media chatter about a cryptocurrency reveals the sentimental analysis of the coin. Social media can amplify fear or greed, and terms like ‘to the moon, FOMO, and Hodl have become popular outside the cryptocurrency space. This is because social media platforms like Twitter, Reddit, and Facebook have large user bases and information shared on these platforms can quickly reach a large audience.
Bitcoin, being the pioneer and most popular cryptocurrency, is one of the most talked-about cryptocurrencies on social media and has a huge following across different platforms. This means major news, like Tesla accepting Bitcoin payments to purchase their cars, can cause a chain of buying sentiments. The crypto market is highly influenced by market sentiment, and social media plays a significant role in shaping this sentiment. Influential figures and crypto investors sharing their positive or negative opinions about Bitcoin can lead to significant price movements.
How to read and predict Bitcoin price movements?
There are two major tools traders can use to predict the next direction of Bitcoin. These are charts patterns and indicators. Chart patterns involve identifying resistance and supports and trying to make sense of positional information of highs and lows. On the other hand, indicators are extra tools used to confirm the information on the charts.
Bitcoin Price Prediction Indicators
Moving Average
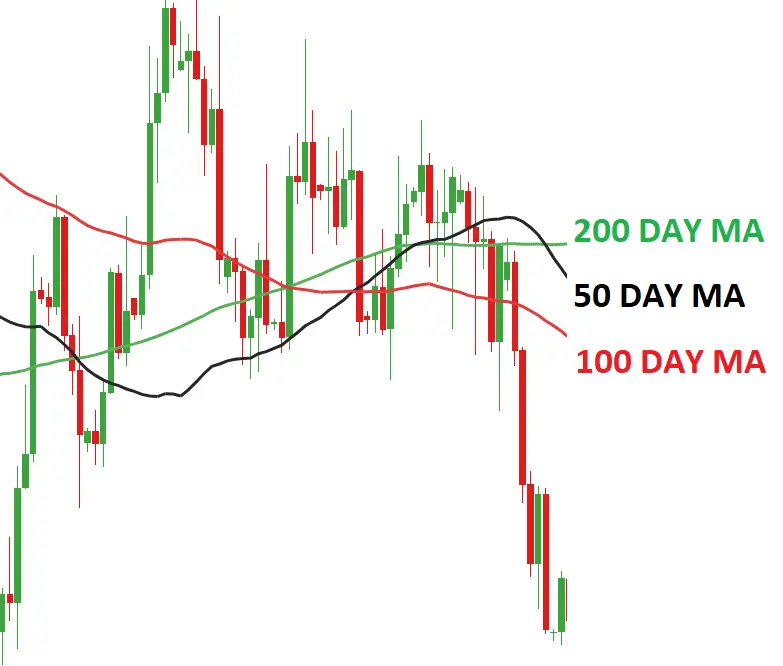
Moving Average indicator looks at an asset's average price over time and then plots that data on a chart. The resulting line can help determine whether the market is moving up, down, or sideways.
For example, if the moving average line is sloping upwards, it may indicate that the market is in a positive trend. Conversely, the line sloping downwards may indicate a downtrend.
It is important to note that while the moving average can be a helpful tool, it is not foolproof. There can be false signals, and it is always recommended to use multiple indicators and analysis methods to confirm trends. Traders often use multiple moving averages of different lengths in order to get a more accurate picture of the trend.
It is important to note that while the moving average can be a helpful tool, it is not foolproof. There can be false signals, and it is always recommended to use multiple indicators and analysis methods to confirm trends. Traders often use multiple moving averages of different lengths in order to get a more accurate picture of the trend.
MACD
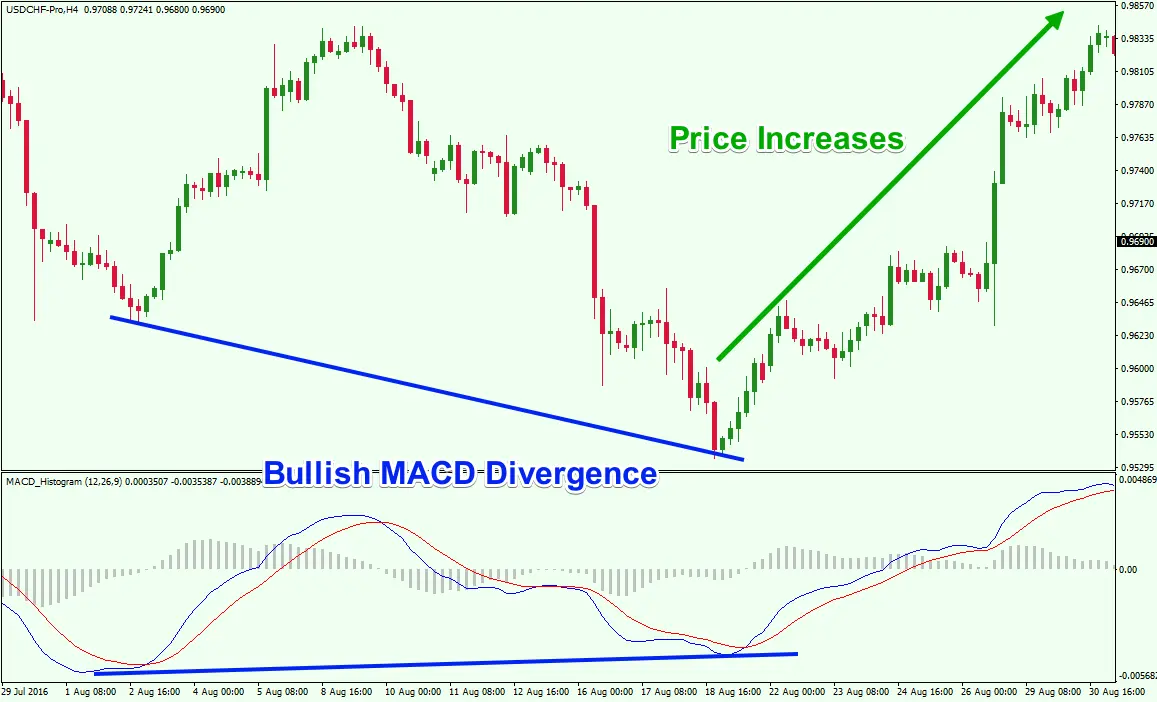
MACD, which stands for Moving Average Convergence Divergence, is a technical analysis indicator that is used to gauge the strength and momentum of a stock or other security. MACD is calculated by subtracting the 26-day exponential moving average (EMA) from the 12-day EMA. The resulting line is then plotted on a chart along with a signal line, which is usually a 9-day EMA of the MACD line.
MACD is considered a lagging indicator because it is based on past data. However, many traders believe that MACD can be used to predict Bitcoin future movements. For example, if the MACD line crosses above the signal line, it may be an indication that the asset is about to experience an increase in value. Conversely, if the MACD line crosses below the signal line, it may be an indication that the asset is about to experience a decline in value.
While MACD can be useful, it should not be used as the sole basis for making investment decisions. Instead, it should be viewed as one tool among many that can be used to make informed investment choices. This is particularly important in the cryptocurrency markets, where the price can be influenced by a variety of factors, including the sentiment, news, and regulatory developments.
RSI
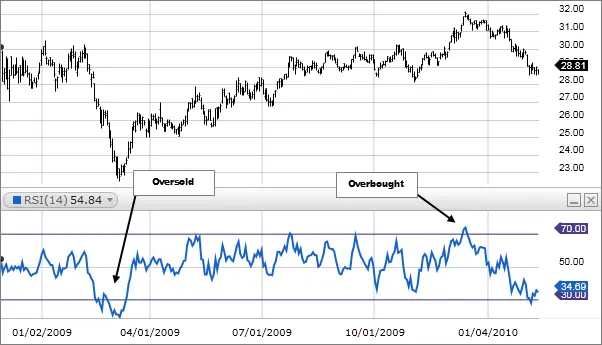
The RSI indicator is a technical analysis tool that measures the level of momentum in an asset. Unlike other momentum indicators, which only take into account the price action, the RSI also takes into account the volume traded.
The RSI is calculated using the following formula: RSI = 100 - 100/(1+RS), where RS = Average Gain/Average Loss. The indicator ranges from 0 to 100, with readings below 30 indicating oversold conditions and readings above 70 indicating overbought conditions.
The RSI is considered to be a leading indicator, as it can often predict reversals before they occur. However, it is important to note that the indicator is not perfect, and false signals can occur. As with any technical indicator, it is always best to use the RSI in conjunction with other tools in order to make more informed investment decisions. For example, if the RSI is showing overbought conditions, but the MACD and moving averages are still indicating a bullish trend, it might not be the best time to sell. Conversely, if all indicators are pointing to a bearish trend, it might be a good time to consider selling.
Bollinger Bands
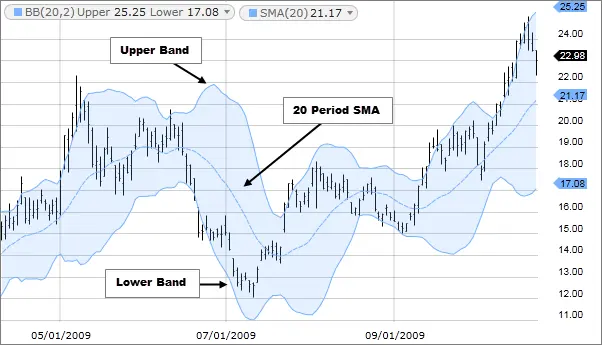
The Bollinger Bands indicator is a technical tool that uses price action to find potential trading opportunities. The indicator is made up of three moving averages: a simple moving average, an upper Bollinger Band, and a lower Bollinger Band.
The simple moving average is used to smooth out price action and help identify the trend. The upper Bollinger Band is placed two standard deviations above the simple moving average while the lower Bollinger Band is placed two standard deviations below the simple moving average.
The Bollinger Bands indicator can be used in a number of ways, but one common use is to look for potential buy and sell signals when the price approaches or crosses one of the Bollinger Bands. For example, a buy signal may occur when the price breaks above the upper Bollinger Band after being in a downtrend. Similarly, a sell signal may occur when the price breaks below the lower Bollinger Band after being in an uptrend.
Candlesticks
Candlesticks charts give a more explicit analysis of an asset’s price action than a line chart. There are two major components of a candlestick; the wick and the body. The wick shows the highest and lowest point during a particular timeframe, while the body shows the opening and closing values.
Candlesticks can also come in either of two colors. A green candle shows the opening price was lower than the closing price. The red wick, however, shows the opening price was higher than the closing one.
Candlesticks can be shown on different timeframes, from short ones like 15s, 30s, and 1m, to longer ones like 4hrs and 1-day charts. This flexibility allows traders to analyze the price action in different timeframes and make more informed decisions. For example, a trader might use a 1-day chart to identify the overall trend, and then use a 1-hour chart to find a good entry or exit point.
You can read more about candlestick patterns from our extensive guide.
Bullish and Bearish Price Prediction Patterns
There are different candlestick patterns that can indicate a bullish or bearish trend, often influenced by factors like market capitalization shifts.
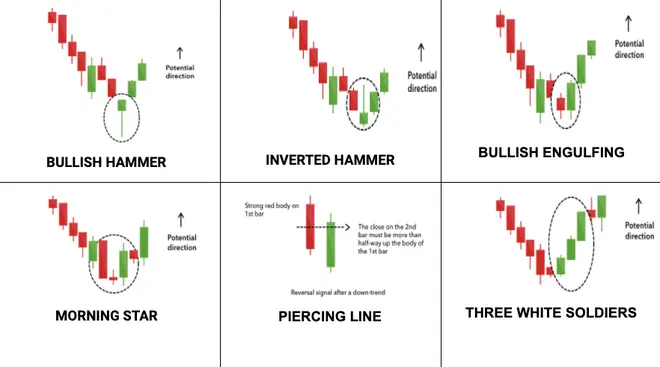
For those anticipating a bull market, especially during times when the capitalization is on the rise, patterns such as the Hammer, Morningstar, and the Three White Soldiers are commonly observed. These patterns suggest a potential upward movement in price, indicating strong investor confidence.
On the other hand, during phases that hint at a bear market, especially when market capitalization might be showing signs of decline, patterns like the evening star, shooting star, and hanging man become more prevalent. These patterns can indicate a potential decline in price, reflecting possible investor apprehension or broader market challenges.
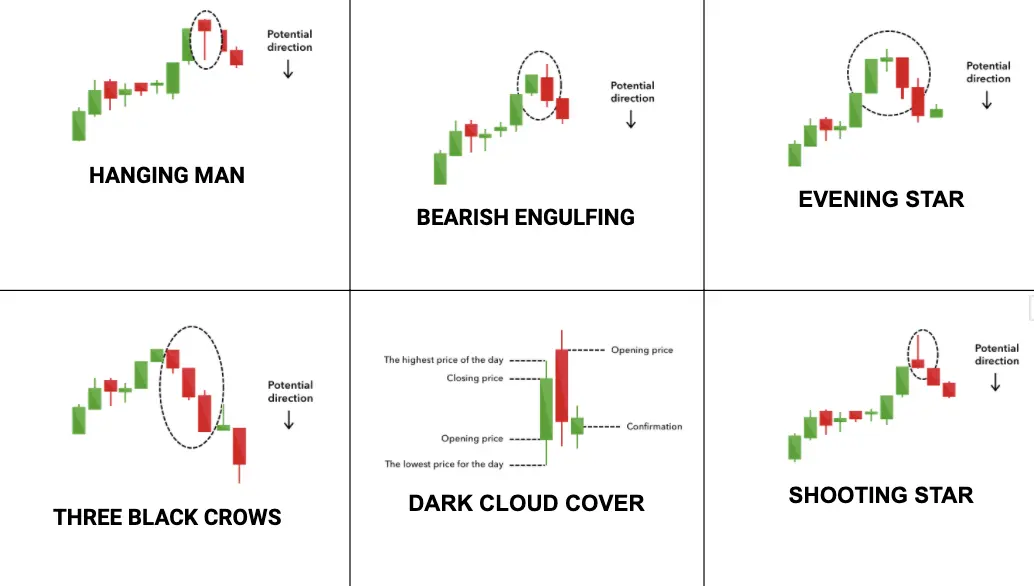
These patterns emerge from the combination of one or more candlesticks. For instance, the Hammer is a single candlestick pattern that appears after a downtrend, signaling a potential reversal. Similarly, the Morningstar, a three-candlestick pattern, indicates a potential bullish reversal after a downtrend.
Final Thoughts
Bitcoin, often referred to as “Digital Gold”, has made a significant impact on various industries. Its decentralized nature and potential for price rise have attracted a diverse range of investors and businesses. As these entities integrate Bitcoin into their financial flows, the cryptocurrency's influence and acceptance continue to grow.
The tools and patterns discussed in this article offer valuable insights into Bitcoin's price movements. Moreover, according to some experts we analyzed in the article, there's a possibility that by 2050, the price of Bitcoin may exceed a million dollars.
However, it's essential for investors to stay informed about global trends, regulatory changes, and technological advancements that could shape Bitcoin's future trajectory. As the crypto market matures, understanding the interplay between industries, capital flows, and Bitcoin's price dynamics will be crucial for both seasoned and novice investors.
FAQ
Is Bitcoin a Good Investment in 2022?
Bitcoin might be a very good investment in 2022. All asset prices are down, and Bitcoin, in particular, is down by almost 70%. This could play out to be a good bargain for long-term investments.
What Will the BTC Price Be in 5 Years?
Several sites have given their Bitcoin predictions for 2027. Changelly sees it at $162,000, Ambcrypto believes it will be closer to $395,000, and PricePrediction sees it at $306,000.
Will Bitcoin Ever Hit $100000?
Although the timing is unknown, the consensus in the crypto market is that Bitcoin will hit $100,000.
How High Can Bitcoin Go in 10 Years?
It will be interesting to see how high Bitcoin will go in 10 years, but the market seems to favour an $800,000 to $1 million price range, according to different sites.
Is It Too Late to Buy Bitcoin?
You could have made a fortune buying Bitcoin in its early days, but corrections are a second chance for a favourable price entry.
How Much will Bitcoin be worth in 2025?
Bitcoin price forecast for 2025 is predicted to be worth between $40,000 and $50,000, according to different prediction sites. Although Changelly Predicts Bitcoin price in 2025 to be roughly $72,000, the general consensus does not exceed $50,000.
*This communication is intended as strictly informational, and nothing herein constitutes an offer or a recommendation to buy, sell, or retain any specific product, security or investment, or to utilise or refrain from utilising any particular service. The use of the products and services referred to herein may be subject to certain limitations in specific jurisdictions. This communication does not constitute and shall under no circumstances be deemed to constitute investment advice. This communication is not intended to constitute a public offering of securities within the meaning of any applicable legislation.


