Best Indicators for Options Trading
Options give investors different ways to make money and add to their investments. The power of this financial instrument can be harnessed with the use of special tools for analyzing options trades. Among these tools, certain indicators have proven to be invaluable.
This article delves into the best indicators for options trading, offering insights into their functionality and relevance in today's market landscape.
Key Takeaways
- Options trading offers diverse avenues for investors to profit, but it demands specialized tools and knowledge for effective decision-making.
- While many traders search for a universal indicator, seasoned traders understand that success comes from a combination of multiple indicators, experience, and market understanding.
- Options’ unique features should also be taken into account while choosing indicators.
- Some of the most valuable indicators for trading options include the Relative Strength Index (RSI), Bollinger Bands, Intraday Momentum Index (IMI), Supertrend, Put Call Ratio (PCR), Open Interest (OI), MACD, Money Flow Index (MFI), and others.
- Ultimately, successful options trading requires leveraging the right indicators, staying updated with market trends, and continuously refining strategies.
Magic Options Trading Chart Indicators Do Not Exist
Many novices harbor the hope of discovering a single, all-powerful tool that can guarantee success. The quest for such a “magic” indicator is very common. However, seasoned traders understand that no single tool offers a foolproof path to profitability. Every indicator, no matter how sophisticated, comes with its own set of strengths and limitations. It's the smart combination of multiple indicators, coupled with experience and market understanding, that often leads to success.
How Options Trading Is Different
Options trading stands distinctively apart from other forms of trading, such as stocks or commodities. Hence, trading options requires specialized knowledge and strategies. The choice of indicators should also be based on the options’ distinctive features.
Let's delve deeper into the options’ peculiarities:
- Derivative Nature. Options trading is derivative in nature. It means that options derive their value from a base asset, such as stocks, commodities, indices, or even cryptocurrencies like Bitcoin. Unlike purchasing a stock where one owns a piece of the company, buying an option gives the trader the right, but not the obligation, to buy or sell the base asset at a predetermined price within a specified timeframe. Indicators like the MACD or RSI can be instrumental in understanding the momentum and potential price movements of these base assets.
- Time Decay. As options have an expiration date, the value of an option decreases over time, all else being equal. This time decay (or “theta”) accelerates as the option approaches its expiration date, making timing crucial in options trading. The Intraday Momentum Index (IMI), tailored for daily price movements, becomes particularly relevant here.
- Leverage. Options provide traders with leverage, allowing them to control a larger position with a relatively small amount of capital. Given the amplified potential for profits or losses, indicators like Bollinger Bands can help traders identify potential price breakouts or reversals, aiding in risk management.
- Premium. When purchasing an option, traders pay a “premium”, which is essentially the price of the option. This premium is influenced by various factors, including the base asset's price, the strike price of the option, volatility, time until expiration, and interest rates. The RSI and Bollinger Bands can be used to gauge overbought or oversold conditions, influencing the option's premium.
- Intrinsic and Extrinsic Value. The value of an option is composed of intrinsic and extrinsic value. The Money Flow Index (MFI), being a volume-weighted RSI, can provide insights into an option's intrinsic value by considering both price and volume.
- Implied Volatility. Implied volatility is as the market projection of the asset’s future volatility. Indicators like the RSI and Bollinger Bands can help traders gauge potential price movements and their strength, especially when considering the market's expectation of future price movement.
Top Technical Indicators for Options Trading
Certain technical indicators have proven especially valuable in options trading. Some of them were briefly mentioned above. Here's a deeper dive into some top indicators for options trading:
Relative Strength Index (RSI)
The Relative Strength Index (RSI) stands as one of the premier oscillators that measures the speed and change of price movements. Its appearance can be traced back to J. Welles Wilder's foundational work in 1978. The RSI fluctuates between 0 and 100, offering a measurable indicator to detect when the market is overbought or oversold.
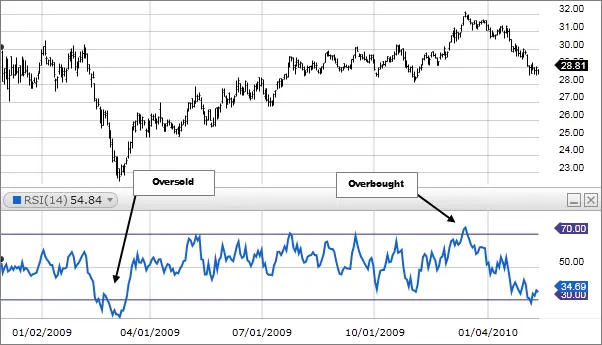
The core principle behind RSI is its ability to measure momentum. It does this by comparing the average gains and losses over a typically predetermined period, (often 14 days). This period can be adjusted based on the trader's preference, with shorter periods capturing more volatility and longer ones smoothing out the data.
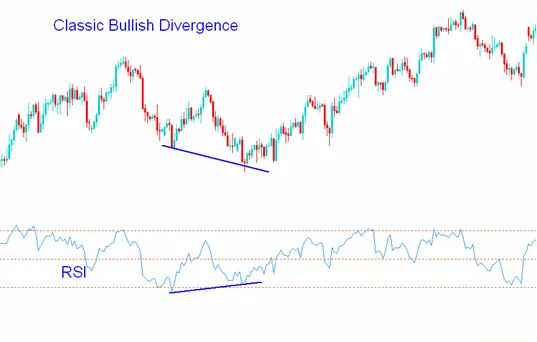
But the RSI's utility extends beyond just identifying overbought or oversold conditions. Experienced traders frequently use RSI to spot divergences. When the price of an asset moves in one direction and the RSI in another, it's a clear indication of a potential trend reversal. For instance, if a stock's price is making new lows, but the RSI is trending upwards, it could signal a bullish reversal.
Moreover, the RSI can be integrated into various trading strategies. By setting different thresholds, traders can adapt the RSI to fit different market conditions. For instance, in a strong bullish market, the overbought threshold might be moved to 80, while the oversold threshold could be lowered to 20.
Bollinger Bands
Bollinger Bands are a powerful tool that encapsulates price movements within a range, determined by standard deviations from a simple moving average. Developed by John Bollinger in the 1980s, these bands have become a staple in technical analysis.
The bands consist of three lines: the middle band (simple moving average) and two outer bands that represent standard deviations from the mean. The default setting is a 20-day simple moving average with bands set two standard deviations apart. However, these settings can be adjusted to fit different trading styles and timeframes.
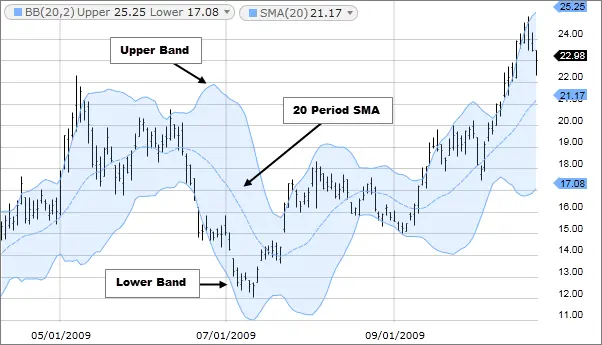
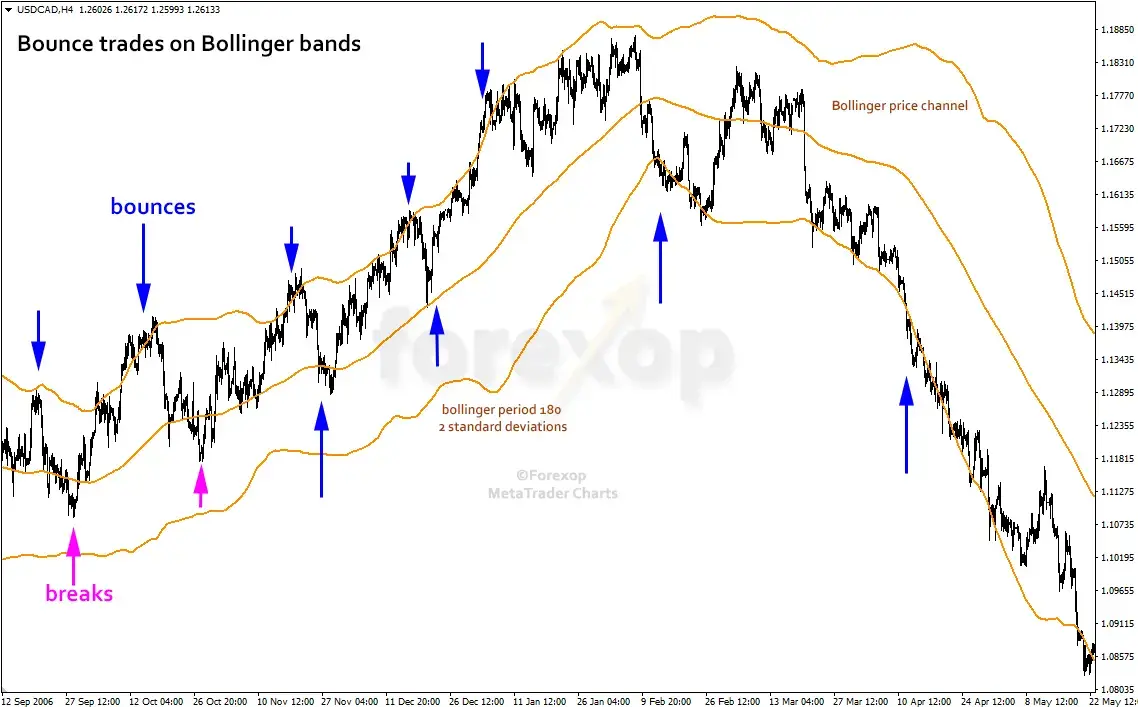
One of the primary utilities of Bollinger Bands is their ability to adapt to volatility. When the bands contract, it indicates a decrease in volatility, suggesting the market is in a consolidation phase. Conversely, when the bands expand, it signals increased volatility, indicating potential breakouts.
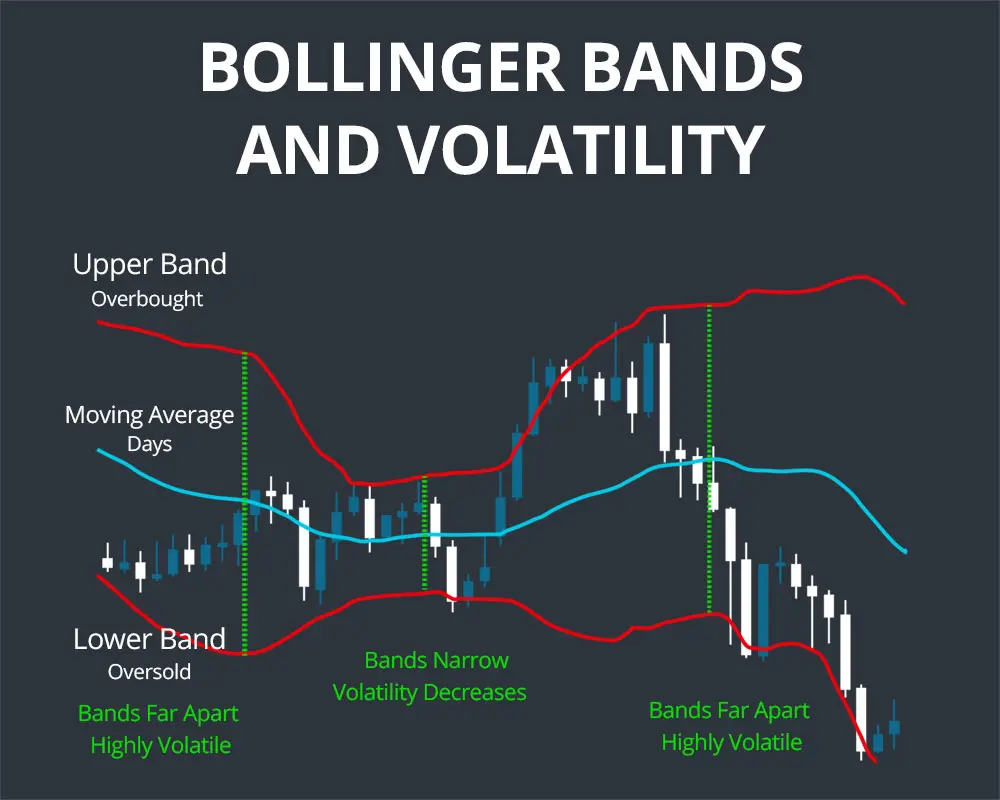
Beyond volatility, Bollinger Bands can be used to identify overbought or oversold conditions. When the price touches or moves outside the upper band, it could be considered overbought. Similarly, when it touches or moves below the lower band, it could be deemed oversold.
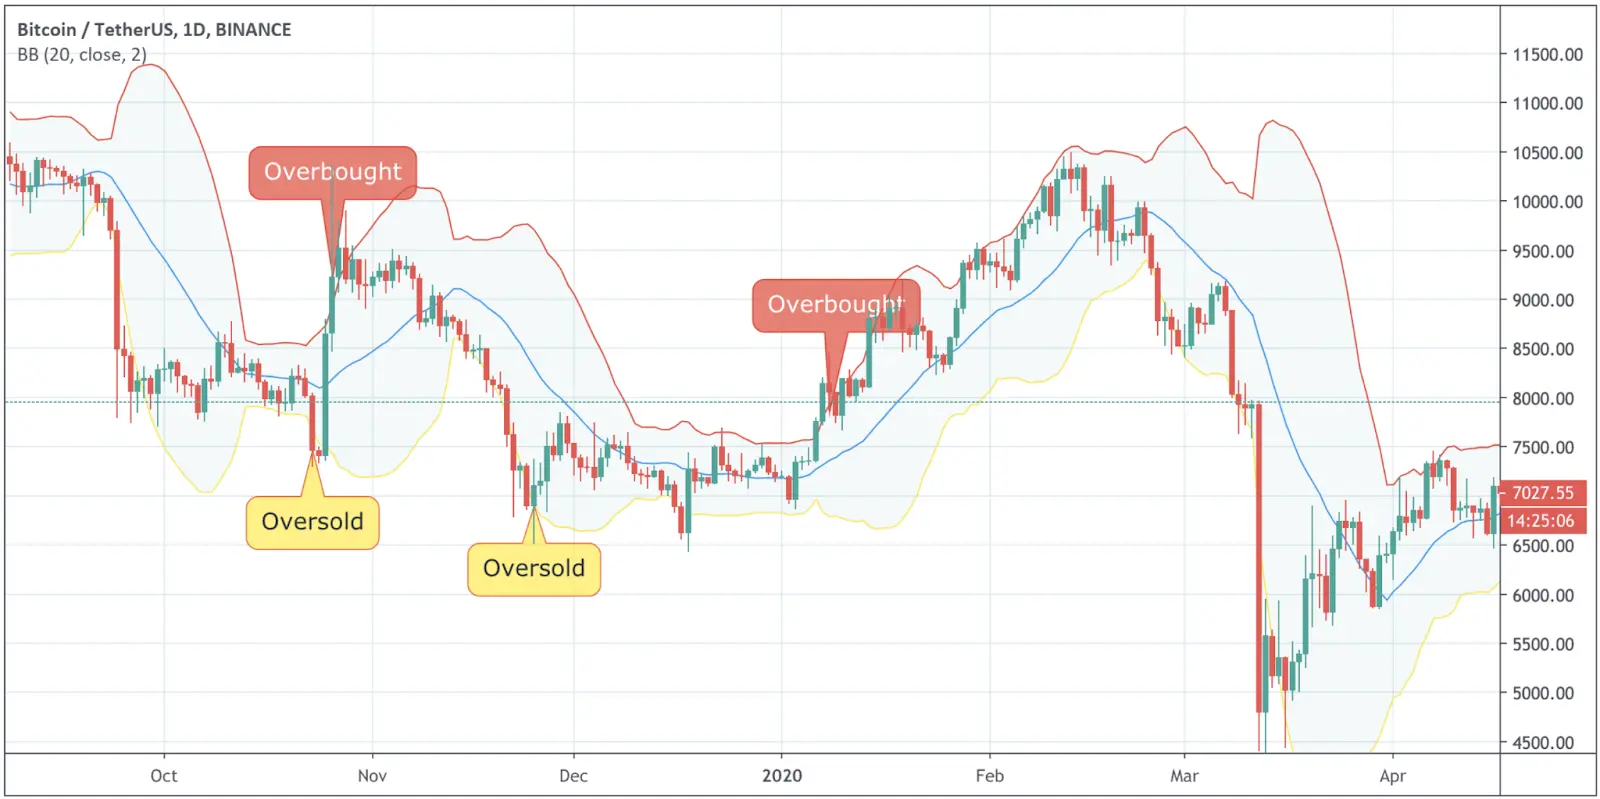
Another advanced technique involves looking for the “Bollinger Bounce”. Prices tend to bounce off the bands, especially in a ranging market. Traders often look for signs of reversal when prices approach the bands.
Intraday Momentum Index (IMI)
The Intraday Momentum Index (IMI) is a unique blend of momentum and candlestick analysis. Tailored for traders who focus on daily price movements, the IMI offers a granular view of an asset's momentum within a trading day.
By differentiating between bullish and bearish days, the IMI provides a clearer picture of intraday price dynamics. It essentially acts as a refined version of the RSI, tailored for intraday movements. The IMI oscillates between 0 and 100, providing overbought and oversold thresholds similar to the RSI.
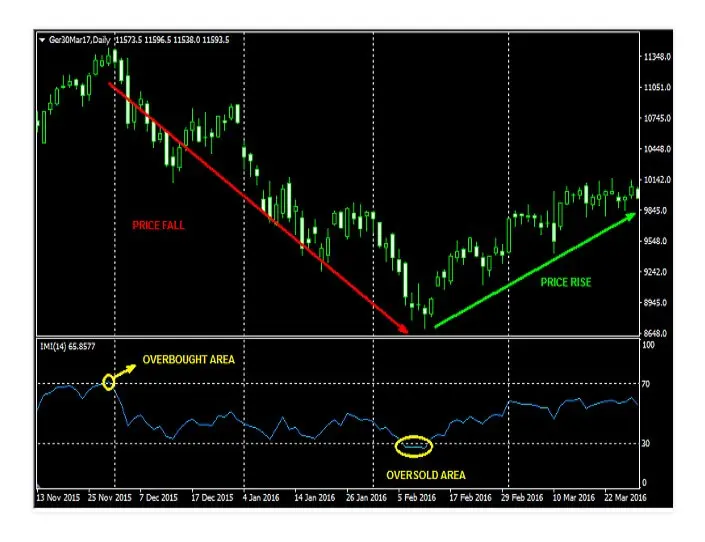
The IMI's insights can be invaluable, as the indicator offers a snapshot of the day's momentum. It empowers traders to make knowledgeable choices based on daily market trends. Moreover, the IMI can be used in conjunction with other indicators for trading options, like moving averages or support and resistance levels, to craft a comprehensive intraday trading strategy.
Supertrend
The Supertrend indicator, as the name suggests, is primarily designed to identify the market's prevailing trend. It's a trend-following indicator that uses the Average True Range (ATR) in its calculations. The Supertrend provides clear buy and sell signals, making it a favorite among many traders.
When the price of an asset is above the Supertrend line, it indicates a bullish trend, suggesting it might be an opportune time to consider buying call options. Conversely, when the price is below the Supertrend line, a bearish trend is indicated, which might be a signal to consider put options.
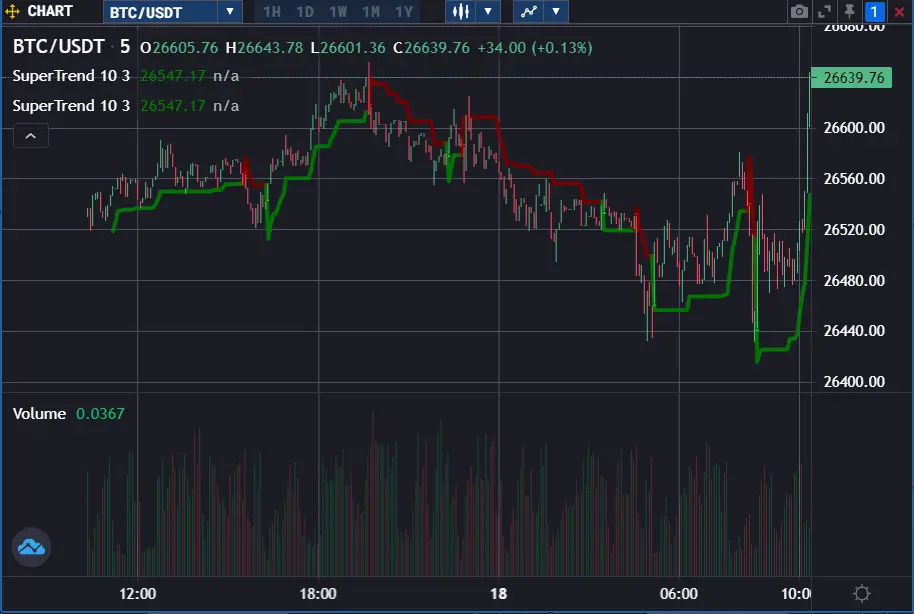
For options traders, the Supertrend can be a beacon, especially for those employing trend-based strategies. It's not just about identifying the current trend; the Supertrend can also signal potential trend reversals. Such insights are invaluable in options trading, where timing is crucial. However, it's worth noting that no indicator, including the Supertrend, is infallible. It's always recommended to use it in tandem with other indicators and to be aware of broader market news and events.
Put Call Ratio (PCR)
The Put Call Ratio (PCR) provides insights into the prevailing market sentiment. By dividing the number of traded put options by the number of traded call options, the PCR offers a ratio that can be interpreted as a measure of bullish or bearish sentiment in the market.

A PCR above 1 indicates a bearish sentiment, suggesting that more traders are hedging or speculating on a decline in the base asset. This could be due to various reasons, such as anticipated negative news, macroeconomic factors, or technical analysis patterns indicating a potential downturn.
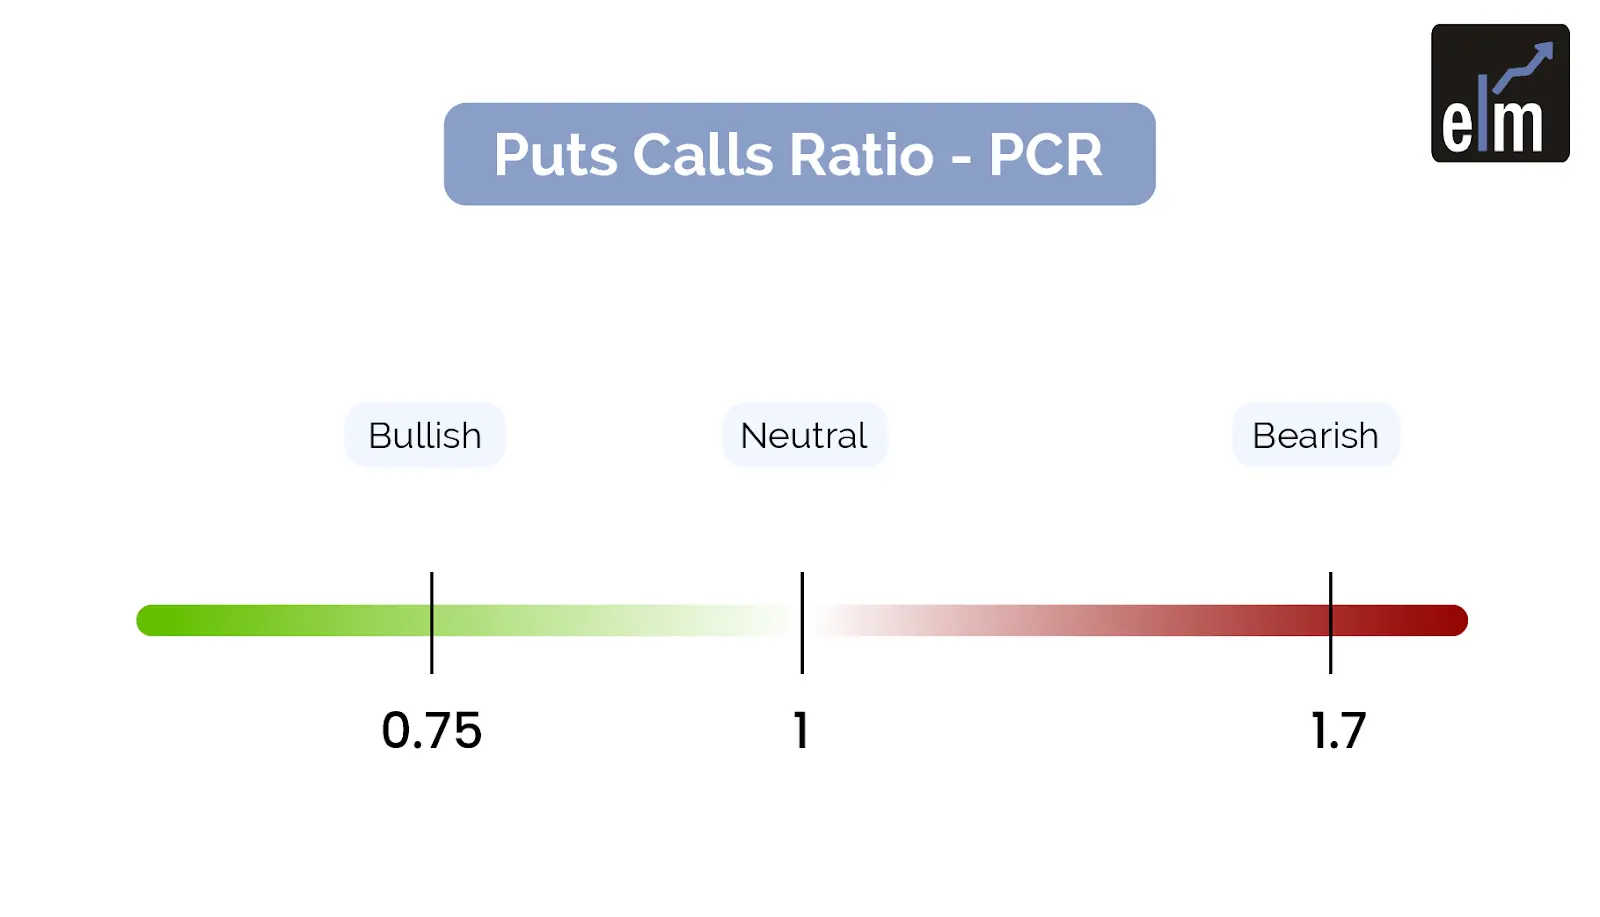
Conversely, a PCR below 1 signals a bullish sentiment, indicating that more traders are speculating on or hedging for a rise in the base asset. This could be driven by positive news, strong earnings reports, favorable macroeconomic indicators, or bullish technical setups.
For options traders, extremely high PCR values might suggest that the market is overly pessimistic, potentially signaling a buying opportunity. On the other hand, extremely low PCR values could indicate excessive optimism, signaling a potential selling opportunity.
Open Interest (OI)
Open Interest represents a live count of outstanding contracts in the market. Unlike trading volume, which accounts for the total number of contracts traded, open interest only considers contracts that are still active and have not been settled or closed.
A rising open interest in conjunction with rising prices can be interpreted as a bullish indicator. It suggests that new money is entering the market, and the prevailing trend is likely to continue. Conversely, rising open interest with declining prices can be a bearish sign, indicating that the trend is likely to persist.
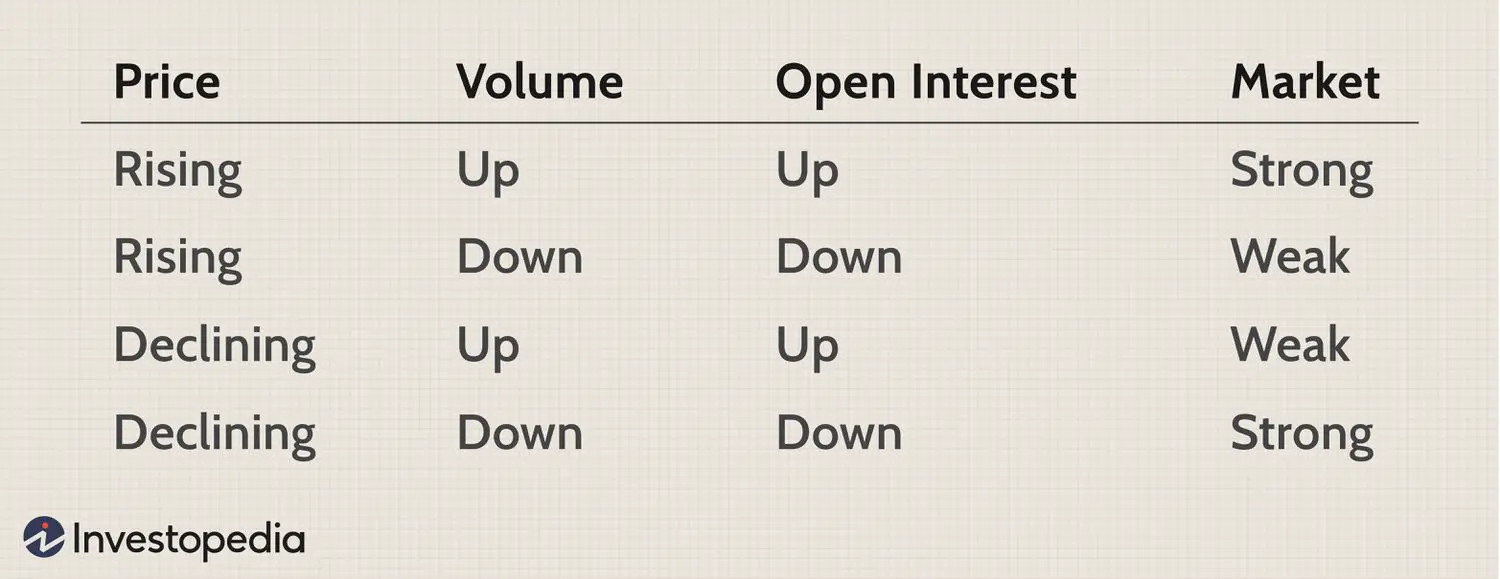
For options traders, open interest provides insights into liquidity and trading activity. Options contracts with high open interest are likely to have tighter bid-ask spreads and better execution, making them more attractive for trading. Additionally, sudden spikes or drops in open interest can signal major market moves, providing traders with potential trading opportunities.
More about OI you find in our comprehensive guide.
MACD (Moving Average Convergence Divergence)
The MACD is a trend-following momentum indicator that reveals the relationship between two moving averages (MA) of an asset's price. The MACD is constructed using the 12-day and 26-day exponential EMAs. The difference between these two EMAs forms the MACD line. Additionally, a 9-day EMA of the MACD line, known as the “signal line”, is plotted alongside to provide trading signals.
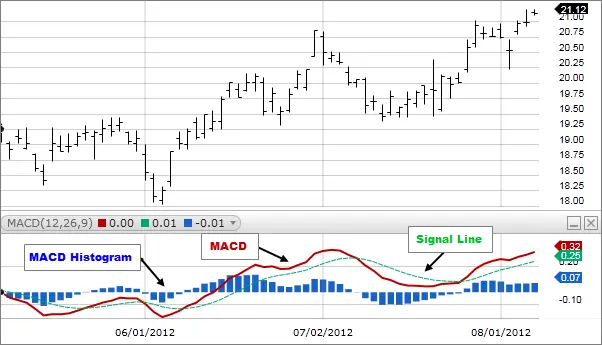
As you can see in the picture above, MACD line and its signal line are accompanied by a histogram that visualizes the gap between them.
You will see a positive histogram is positive (above zero level) when the MACD line is above the signal line. And vice versa, a negative histogram (below zero) appears when the MACD line is below its signal line.
The MACD serves multiple purposes:
- First, it offers insights into the momentum of an asset. When the MACD line moves over the signal line (resulting in a positive histogram), it signifies a bullish trend, indicating that the asset is gaining upward momentum. On the other hand, when the MACD line dips below the signal line (leading to a negative histogram), it suggests a possible decline in momentum.
- MACD helps traders to spot divergences. If the asset's price is making higher highs, but the MACD is making lower highs, it indicates a bearish divergence, suggesting potential price reversal. Similarly, if the price is making lower lows, but the MACD is making higher lows, it signals a bullish divergence.
Overall, MACD is a versatile tool. It can guide entry and exit points, especially when combined with other options trading indicators. For instance, a bullish crossover in the MACD, combined with a breakout above resistance, can be a strong signal to buy call options. Conversely, a bearish crossover, along with a breakdown below support, might suggest the profitability of put options.
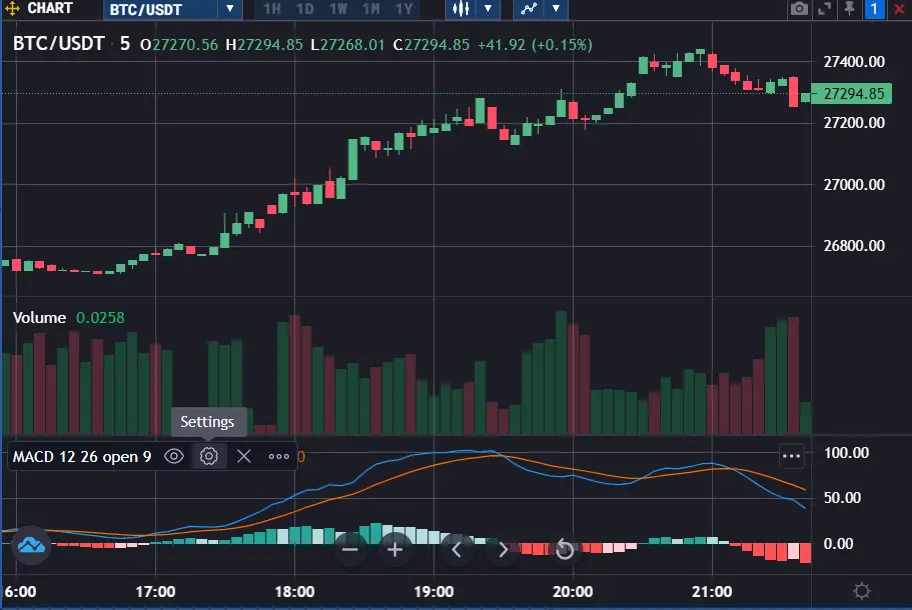
On Redot, you can easily set your own parameters for MACD in the indicator’s settings:
Money Flow Index (MFI)
The Money Flow Index, often referred to as the volume-weighted RSI, is a momentum oscillator that takes into account both price and volume. It operates within a range of 0 to 100, providing insights into potential overbought or oversold conditions. An MFI value above 80 typically indicates that the asset is overbought, suggesting a potential price decline in the near future. On the other hand, an MFI below 20 can indicate that the asset is oversold, signaling a potential price rise.
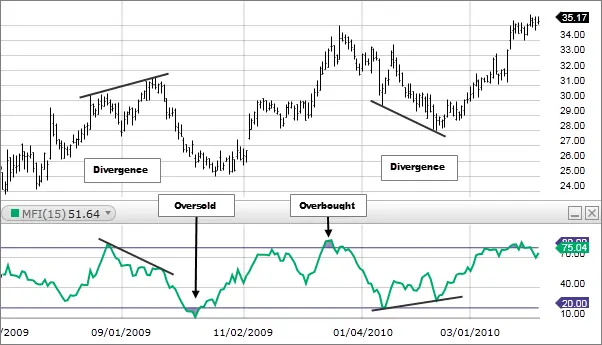
The MFI is particularly valuable for options traders because it doesn't just consider price movements; it also factors in trading volume. This dual approach provides a more comprehensive view of buying and selling pressure.
For instance, if an asset's price rises with a corresponding increase in volume, it could indicate strong buying interest, suggesting the upward trend might continue. Such insights can guide traders in selecting call options. Conversely, if the asset's price falls with increased volume, it could signal strong selling interest, indicating the downward trend might persist, guiding traders towards put options.
The Bottom Line
Navigating the intricate world of options trading requires a blend of knowledge, strategy, and the right tools. Indicators, while invaluable, are just one part of the puzzle. As mentioned above, no single indicator guarantees success. The key lies in understanding the nuances of each tool, combining them effectively, and staying adaptable to the ever-evolving market dynamics.
The rise of digital assets, especially crypto like Bitcoin, has added a fresh layer of complexity to the trading landscape. These assets, with their distinct volatility patterns and market dynamics, necessitate a unique approach. Traditional indicators, while still invaluable, might need adjustments when applied to the cryptocurrency domain.
It is also recommended to try the strategies with various indicators on a demo account first. By trying indicators with different settings traders can develop the best strategy. It will give them more confidence and precision when trading with real funds.
FAQ
Which Indicator Is Best for Options Trading?
There isn't a one-size-fits-all answer. The best indicators to use for options trading depends on the trader's strategy, risk tolerance, and market conditions.
Which Indicator Has Highest Accuracy?
No indicator guarantees 100% accuracy. However, combining multiple indicators can enhance decision-making.
Is RSI Good for Option Trading?
Indeed, RSI is a flexible instrument that can aid options traders in pinpointing possible entry and exit positions.
*This communication is intended as strictly informational, and nothing herein constitutes an offer or a recommendation to buy, sell, or retain any specific product, security or investment, or to utilise or refrain from utilising any particular service. The use of the products and services referred to herein may be subject to certain limitations in specific jurisdictions. This communication does not constitute and shall under no circumstances be deemed to constitute investment advice. This communication is not intended to constitute a public offering of securities within the meaning of any applicable legislation.


